makindetoyosi2
Price was previously bullish, formed a head and shoulders pattern, broke the neckline. Wait for retest and short
Price was previously bullish, formed a double top on the Higher time frame. Wait for retest of the broken support zone and opt for a buy.
Price was previously bearish, formed an inverse head and shoulders pattern. Broke out of the neckline. Wait for retest in combination of a bullish candlestick pattern and long.
Price is bearish on the monthly TF, price touched the trend line and formed bearish candlestick pattern on the weekly timeframe, price retested a resistance zone and broke the counter trend line.
Price is previously bullish, retested a major support zone and formed an inverse head and shoulders pattern with a break and a retest of the neckline.
Price is bearish overall, it retested the previous resistance zone and gave a bearish candlestick pattern.
Price is consolidating, price already gave a bullish momentum impression. Wait for break and retest of the resistance zone above and bullish candlestick pattern.
Price hit a low, formed an inverse head and shoulders pattern, broke out and retested the neckline and a morning star candlestick pattern.
Price broke out, Wait for a retest. Trendline + fib 50 level with a bullish candlestick pattern.
Price was ranging, it broke out and retested the zone with a touch of double bottom and the retest of the neckline.
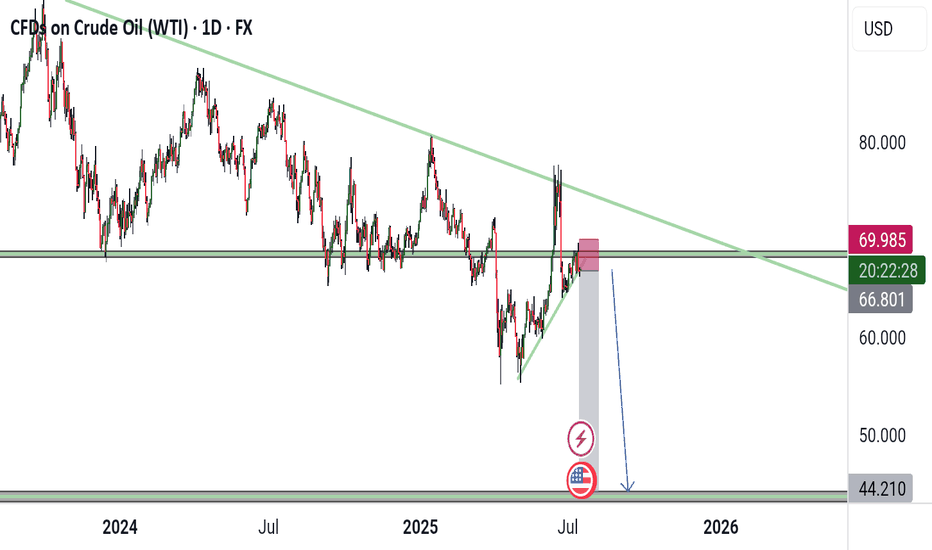
Price is bearish on the daily, it broke out of the major zone and retested it, with a bearish candlestick pattern.
Price was previously consolidating, broke out and retested the previous support zone,with a nice double bottom and a bullish pinbar. We go long.
Price hit a major resistance level, failed to break above it in the past, bounced it off thrice. It broke out of the support below and retested it. Wait for bearish candlestick confirmation and take entry for short.
Price hit a major weekly zone, formed an inverse head and shoulders pattern. Price broke out of the neckline, wait for retest and a bullish candlestick pattern for long.
Price got to a higher timeframe keylevel, consolidated, broke out and retested the resistance zone.
Price was previously ranging, broke out and retested the neckline. Price broke out of the bearish channel wait for a retest of the support zone and we can go long.
Price is bearish on the higher timeframe, price broke the immediate bullish trendline. Wait for a break and a retest of the support zone below, and a bearish candlestick pattern for short.
Price formed got to a monthly resistance zone, formed a double top. Price broke out of the neckline, let's wait for a retest and a bearish candlestick pattern for short entry.


