A comparison of ETH and BTC Direction over different time periods. Ethereum is in blue and BTC is in gray. Direction arrow indicates trend pattern for different time periods using linear regression. Price scale is not relevant for Ethereum. Support this idea with your likes and comments! Thanks
This chart shows 7 different indicators in 1. I've got it set to show green background and go Long when 4 indicators are green and white background and Close position when less than 3 indicators are green. Tezos Bullish! Still testing the Multiview indicator, but If you have a coin or stock you'd like me to show, just request it in the comment section...
No matter how you view it Bitcoin is weak right now. Hopefully it can regain it's upward mojo soon! This chart shows 7 different indicators in 1 I've got it set to show green background and go Long when 4 indicators are green and white background and Close position when less than 3 indicators are green. Still testing the Multiview indicator, but If you have a...
Hello and thanks for checking out my analysis. It would be nice to see Bitcoin get above and hold the line shown on the chart. That marks the close from Oct 6 and approx. the high from last week, Nov. 29. We're not that far away from that mark. It could provide a spot that the bulls can build on. Thanks and thumbs up if you agree.
Here's my work on Bitcoin price support The blue line shows a 61.8 percent retracement at $7513 of Bitcoin price, (beginning at $1 thru $19666, the first bull run). The orange line shows a 61.8 percent retracement at $7231 of Bitcoin price, (beginning at 3122.28 thru 13880 , the second bull run). These two retracements are virtually identical in price which adds...
Here's my work on Bitcoin price support: The blue line shows a 61.8 percent retracement at $7513 of Bitcoin price, beginning at $1 thru $19666 The orange line shows a 61.8 percent retracement at $7231 of Bitcoin price, beginning at 3122.28 thru 13880 (the second bull run). These two retracements are virtually identical in price which is adds confirmation to this...
Hey Traders! Here's the prevailing direction for BTC. A new bearish signal starting today. Please "thumbs up" if you appreciate. Thanks!
Hey Traders! Here's the daily signal for BTC. Orange line means short term bearish. Please click "thumbs up" if you appreciate. Thanks!
An inverse Head and Shoulders pattern on the hourly chart indicates that if Bitcoin price can hold above 11,433 then a price above 13,000 is the target.
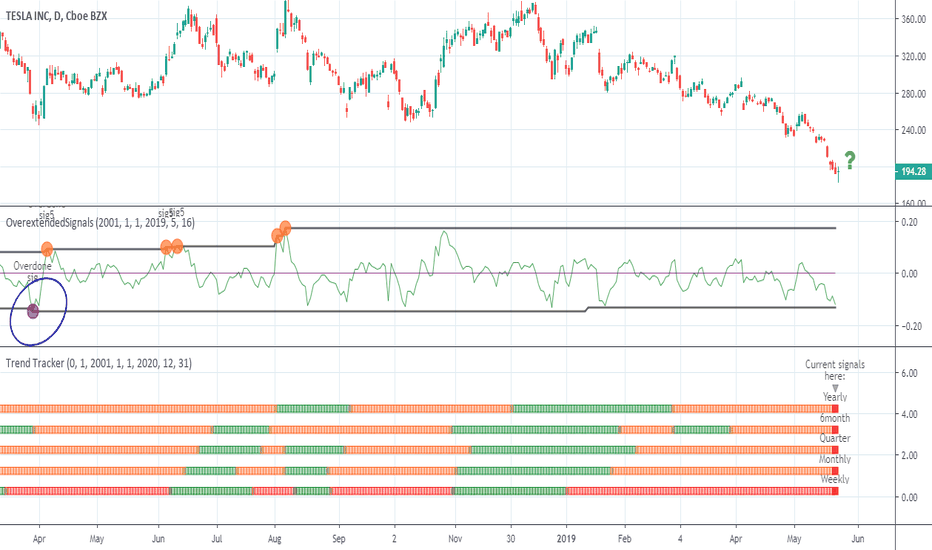
Hello Traders! I hope you are doing well and on the profitable side of the markets! Here's a look at the TSLA chart today. I bring it up because even though it has been decidedly bearish, there may be a rising coming soon. How much, I don't know. The reason I say this is because it is approaching the Overextended line to the downside. This situation could...
Hey Traders! Here's a projection for the target price of Ethereum. Conceivably this pattern is a bull pennant. The Measured Move rule computes the target price of a bull flag/bull pennant pattern by measuring the height from the bottom of the flag pole to the top (A) and then add that same amount from the bottom of the pennant (B). If this pattern plays out,...
Hello Traders! After previously climbing above key retracement levels, AAPL momentum has shifted downward. Price will have to close above 187.76 to regain bullish course. Like if you can! Thanks!
Hello Traders! Hope you're having a great day and that you've been on the profitable side of the market these days. Here's what I'm seeing on the Bitcoin chart: First off, of course we're in an uptrend -and on every time level that I'm tracking here (Shortest time frame to Longest time frame). The green bands are signals of moving averages. They're all...
Here are the top 20 coins by marketcap plotted next to each other for comparing. Hope you find it helpful to see trends and patterns. All numbers are in millions except Bitcoin times 10milion. Expand chart if needed to view better. Please like and follow if you find helpful!
I'll try to keep list updated regularly to see coins moving up through the ranks. Please Like and subscribe if you agree! (marketcap) Coin, Rank, Weekago, Change XLM 8 9 +1 ADA 9 10 +1 USDT10 8 -2 DASH14 15 +1 IOTA 15 14 -1 XTZ 19 21 +2 --------------Top...
Bluzelle looking Bullish. Weekly signal: Bullish. Strong volume. Higher Highs, Lower Lows. Breaking above previous high. Use Go / No Go line to determine In or Out, or Back In.
Thought this would be interesting to show the channel that Bitcoin is currently in along with Fibonacci levels following that trend. Long if price stays in major channel.


