markrivest
EssentialIntermediate wave (5) up from the 04/07/25 bottom could be nearing completion. Minor wave 5 of (5) is close to a Fibonacci relationship with Minor wave 1. Using leeway around the 6,208 target gives a broad zone of 6,175 to 6,220. The SPX could reach this zone on 06/27/25.
The S&P 500 - (SPX) could soon complete a five - year Elliott Impulse wave that began in March 2020. Fibonacci resistance is in the SPX 6,200 area which could be reached on 06/26/25 or 06/27/25.
A request was made for clairification of my recent NDQ Elliott wave count. This is a detailed count of NDQ - Minuette wave (iii).
The Nasdaq 100 (NDQ) has a completed extended Elliott five wave Impulse pattern from the 04/07/25 bottom. Three - hour Stochastic is in the overbought zone and on the verge of a bearish cross. RSI and MACD have bearish divergences. A break below the rising trendline could be an important sell signal.
Tesla Inc. has several bearish signals. On 05/29/25 it peaked close to 02/19/25 top. RSI on 05/29/25 had a bearish divergence vs. its 05/14/25 reading. Also, the reading on 05/30/25 was below the reading made at 05/21/25, predicting price could go down to the where it was on 05/21/25. Stochastic has a bearish line cross in the overbought zone above 80.00. On...
The S&P 500 stocks above their 20 – day moving average has reached near the levels of the SPX 2022 bear market. If not already peaked the SPX rally could terminate in one or two trading days.
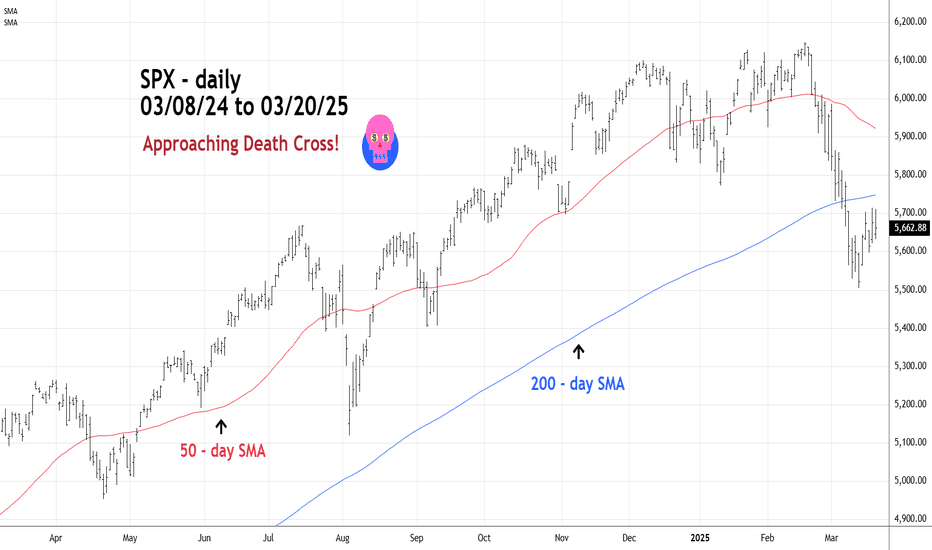
The S&P 500 (SPX) could soon have a cross of the 50 – day Simple Moving Average (SMA) below the 200 – day SMA. This is called a Death Cross and is usually the prelude to more decline. In this case after the crossing the SPX could drop to 4,500 in a few trading days.
Tesla Inc. (TSLA) Elliott wave count implies more downside action. Daily Stochastic is overbought and implies Minor wave"4" could be complete. TSLA could make a significant bottom in the 150 to 175 area.
When the 50 – day Simple Moving Average (SMA) crosses below the 200 – day SMA it’s called a “Death Cross” and frequently signals additional selling. The S&P 500 (SPX) is close to a Death Cross!
Recent action of TSLA appears to be an Elliott Impulse wave. If so, this could mean more downside action. The most likely first downside target is in the 185 area. So far daily RSI is only marginally into the oversold zone. Please note the extremes RSI reached before a turn happened. MACD has only a small bullish divergence which also implies more downside...
An Elliott – Impulse wave down from the S&P 500 (SPX) all-time high appears to be complete. If so, this could be the first wave of a larger developing bear trend. Evidence from the 15 – minute MACD and RSI support this theory. Both had bullish divergences at the 02/28/25 intraday bottom. This is a typical action after a fifth wave termination. There’s a good...
The S&P 500 (SPX) appears to be forming an Elliott Impulse wave down from the all-time high made on 02/19/25. A short-term bottom in the 5,570 to 5,960 area on 02/25/25. Watch 30-minute RSI for possible bullish divergence.
The S&P 500 (SPX) could be nearing completion of an Elliott wave – Ending Diagonal Triangle (EDT) that began after the 11/04/24 bottom. This formation is the terminal phase of a larger degree trend. Price frequently throws over the trendline connecting the peaks of the third and first waves. In this case the target zone is SPX 6,145 to 6,165. Time zone for...
The S&P 500 (SPX) could be very near the completion of a 28 – month extended Elliott Impulse wave that began in October 2022. There are always alternate Elliott wave counts. Followers to my website will notice that the count illustrated in this post is slightly different to what was shown on the website. Both wave counts have the same message – a multi –...
Attention – this is a Red Alert! This is a Red alert! The main three U.S. stock indices, S&P 500 (SPX), Nasdaq Composite (IXIC), and Dow Jones Industrial Average (DJI) have recorded a major bearish momentum divergence. In December 2024 all three indices recorded new all-time highs. Last week for several days only SPX reached a new all-time high. This...
The Dow Jones Industrial Average (DJI) since it’s 12/04/24 all – time high has a very clear Elliott wave pattern. From 12/04/24 to 12/20/24 there is a clear five wave Impulse pattern. Followed by an Elliott wave – Expanding Flat correction. Primary target for a top is at the Fibonacci .618 retracement of the 12/04/24 to 01/13/25 decline. Right near this target...
Since the late October to mid – November 2024 decline Gold has gone sideways and could be forming an Elliott wave – Horizontal Triangle. Within this structure there’s usually a Fibonacci relationship between alternate waves. In this case wave “D” is close to .618 of wave “B” Wave “C” is close to .618 of wave “A”. If the wave count is correct Gold could decline...
Using the Ichimoku Cloud indicator is a great tool to determine long-term trends and occasionally trend changes. Note on the Gold chart price stayed below both cloud boundaries from May to November 2022. Then in mid-November price decisively moved above both cloud boundary lines. The size of the price move is a main clue of potential trend changes. In March...


