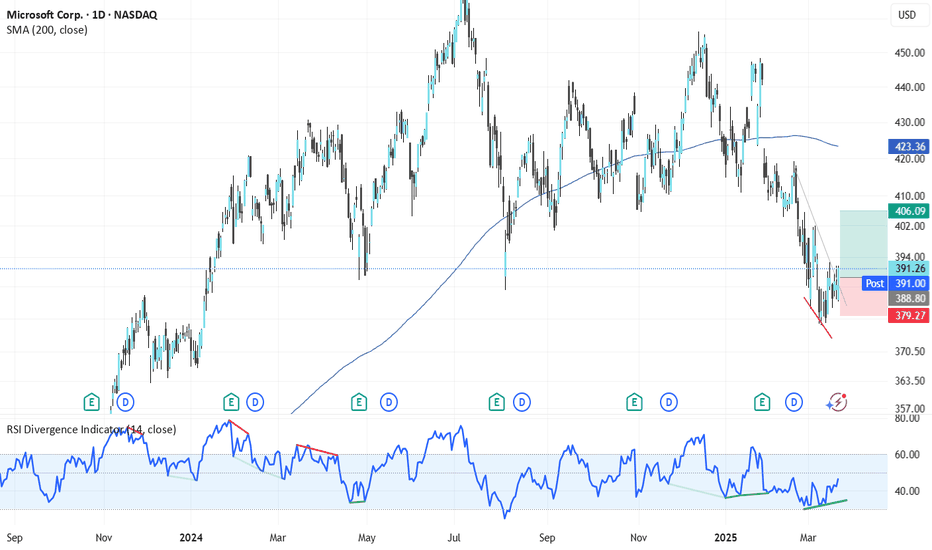
Buy limit amazon Idea Taking into account RSI + price action looks like a good timing to build a buy position
I anticipate a bounce in the Microsoft stock price, based on the following observations: Bullish divergence in RSI Breakout above a bearish trendline.
Based on past behavior, I'm attempting to extrapolate it to the current situation. I observe similar characteristics.
Buying NASDAQ. I'm buying on the CME_MINI:NQ1! , taking into account: The RSI (Relative Strength Index) is in oversold territory. The Fear/Greed Index is showing panic. The VIX (Volatility Index) is at a high level. I'm simply looking to make a buying trade and sell on a bounce, as the trend could still be bearish.
Bearish idea on AAVE. The chart explain itself. I think downtrend can be kept so far BINANCE:AAVEUSDT
BCH could repeat a fractal pattern. Let's see BINANCE:BCHUSDT
$XAGUSD $SILVER long idea. Double double bottom. With the current situation it seems a good a idea to hold longs in xagusd and xauusd
CUP & Handle pattern on $LINK. Target price would be aroud 27,25, but at 26$ there is a resistance level so it could be a good level to take some profits
long term idea. $HTR. This crypto has a great potential, currently is 275# in coinmarket cap with a market value of €228,872,326.
Buying bnb in panic market. I still see strengthness in this crypto
Fundamental Analysis: Stimated EPS for 2022 of 1,55. PER ratio average of 16x in last 5 years. Potential price in 2022 of 1,55*16 = 24,8$ TECHNICAL Analysis: Head and shoulders pattern, price moving obove 200 moving average.
Long term idea with flatexdegiro. Good fundamentals for this company. Increasing net income Let's see if the trend can continue next year
AAVE today is having a great strengthness. I think the chart is self-explanatory
head and shoulders pattern. $DENT. proyection to .0011 aprox
This triangle could be broken and the could be considered as a uptrend continuation pattern
Broken triangle. No need for explanation, see Chart
Fundamental Analysis: CVS has an stimated EPS in 2023 of 7,40(marketscreener) and 8,23(tikr). Applying a possible PER of 13x in 2023, this give us a potential price of 96,2-$106$. Technical Analysis: Since Resistance of 82$ has been broken it this can lead the price to next resistance level in 97$. Considering both analysis, I'm bullish with this stock.
Looks like QCOM is providing good financial results while this triangle has been built. Let's see if the current resistance could be broken and the bullish trend can continue


