maswifelix1999
Price retested the 1.8420–1.8437 supply zone and showed a clear rejection, aligning with the previous trendline break. We're now seeing lower highs forming with bearish momentum. 🔻 Entry: Around 1.8410 – 1.8400 🎯 Target: 1.8313 (previous demand zone) 🛑 Stop Loss: 1.8437 (above structure) Bias: Bearish below 1.8437 zone If momentum continues, price could drop...
Reasons for Possible Buy: Price is sitting on a rising trendline acting as dynamic support. Strong horizontal support zone previously acted as demand. Signs of a potential bullish reaction or bounce after extended downside. Trade Plan: Looking for bullish confirmation (candle structure or momentum shift) around this level. If confirmed, potential...
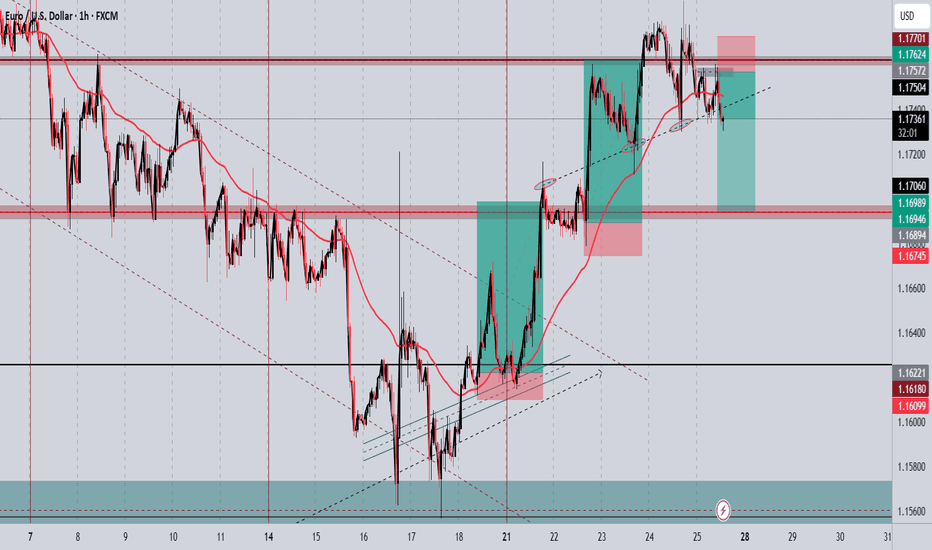
Price has rejected near resistance, forming lower highs. Potential bearish divergence on momentum indicators (RSI/MACD). Market sentiment suggests euro strength may be cooling after recent ECB hold. Dollar shows signs of stabilization, adding downward pressure to the pair. 🔹 Trade Details: Entry: 1.17572 Take Profit: 1.16946
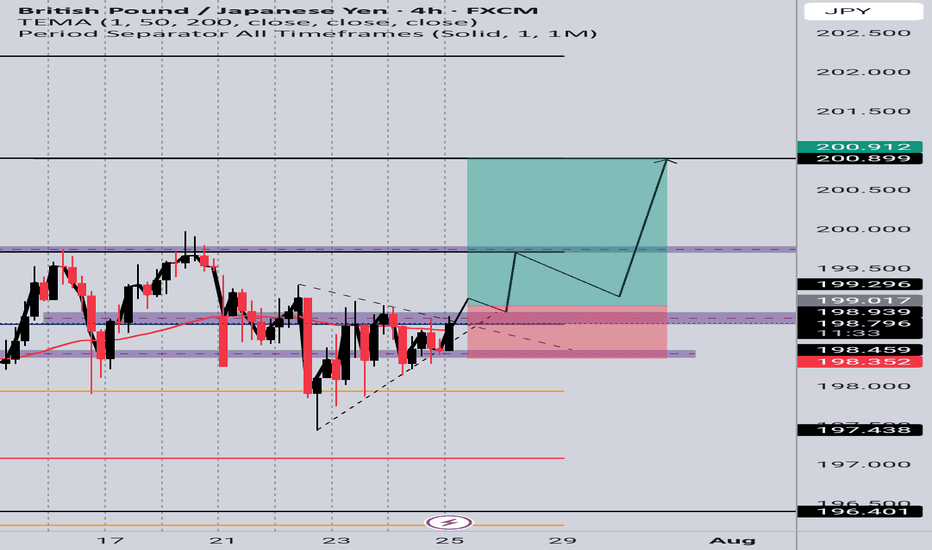
📈 Entry: 199.017 🎯 Target: 200.912 🔒 Reason: Bullish momentum in play with clean structure. Buying the breakout continuation aiming for psychological resistance near 201.00.
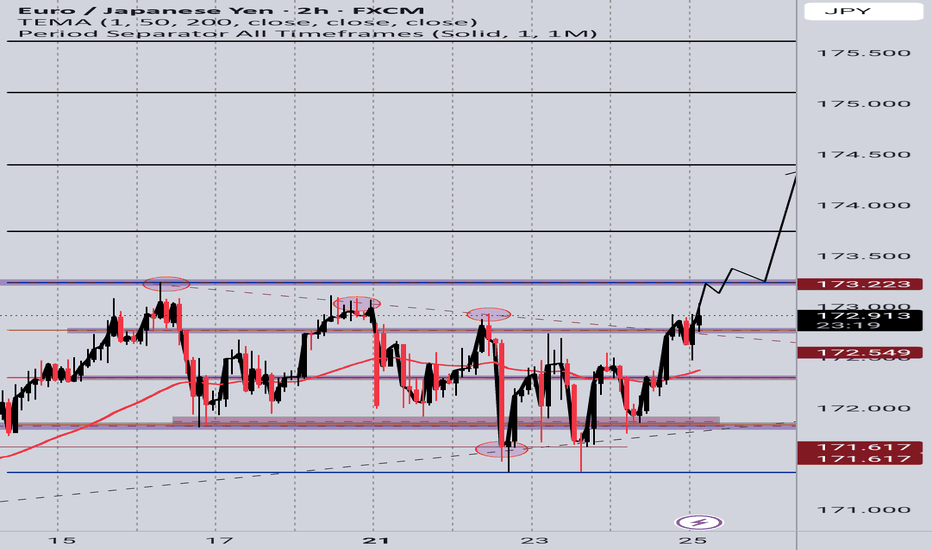
EURJPY Buy Setup 📈 Entry: 172.807 🎯 Targets: TP1: 173.742 TP2: 174.389 🔒 Reason: Price has broken out of a bullish symmetrical triangle pattern, signaling continuation to the upside. Watching for momentum to push toward key resistance levels.
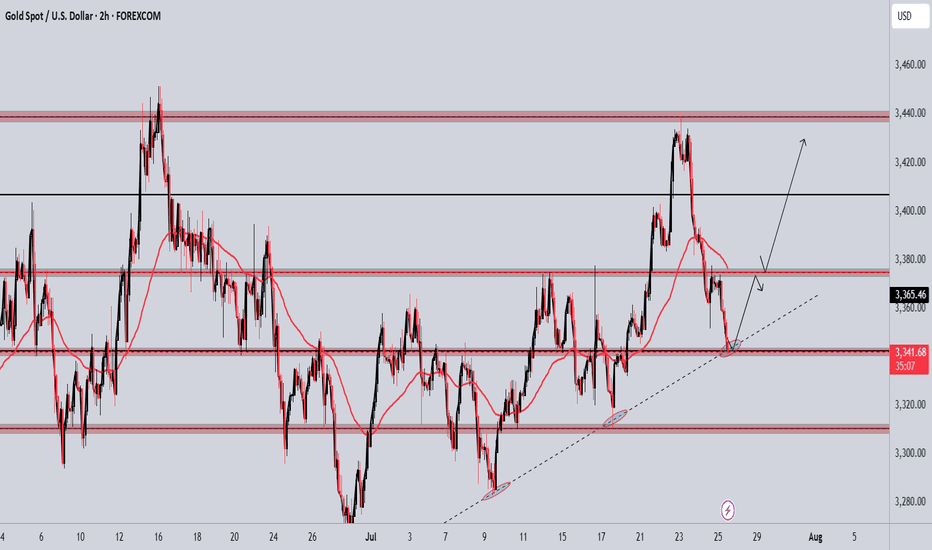
Price is respecting the ascending trendline and demand zone. Expecting a bullish continuation from the 3,360–3,350 support area toward the 3,450 and 3,500 levels. Watching for rejection and confirmation within the demand zone before entry 🔹 Trendline Support 🔹 Demand Zone Bounce 🔹 Target Zones: 3,450 / 3,500
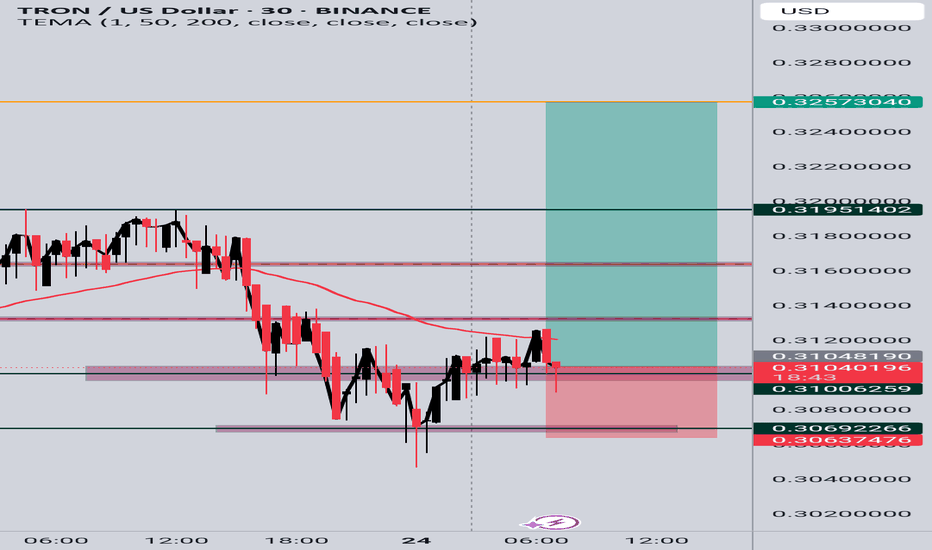
TRX/USD Long Setup (30m Chart) Price formed a consolidation base around 0.3100 after a strong drop. I entered long on a potential bullish breakout above the short-term structure, targeting partial profits at key resistance levels: TP1: 0.3195 TP2: 0.3257 Stop loss is set below recent support near 0.3063. Entry is based on a possible reversal and EMA resistance break.
We failed the bullish momentum on previous chart ,now aiming for the continuation to the downside; 🔹 Entry Zone: 3425–3430 (Supply Rejection) 🔸 Trendline Break + Liquidity Sweep Confirmed 🎯 Targets: — TP1: 3410 — TP2: 3388 (Major Demand Zone) 🔒 Bearish momentum building, watching for continuation toward the lower zone.
GOLD BUY ENTRY 🔹 Entry: 3425.40 🎯 Targets: — TP1: 3438 — TP2: 3445 🔸 Expecting bullish continuation after recent structure break and momentum shift.
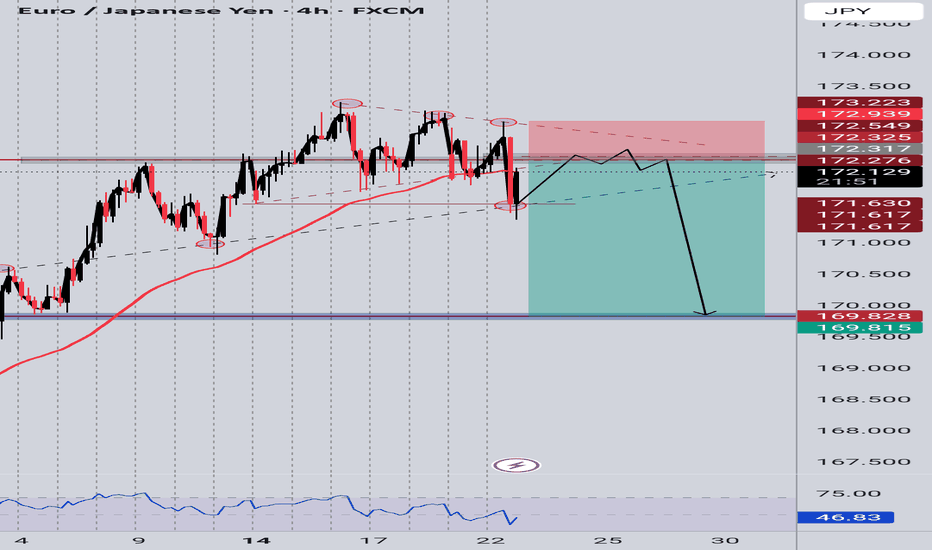
If price fails to reclaim above 172.5 and prints a bearish confirmation candle on the retest, it's a high-probability short opportunity targeting the 170.000–169.800 support zone — as you've marked.
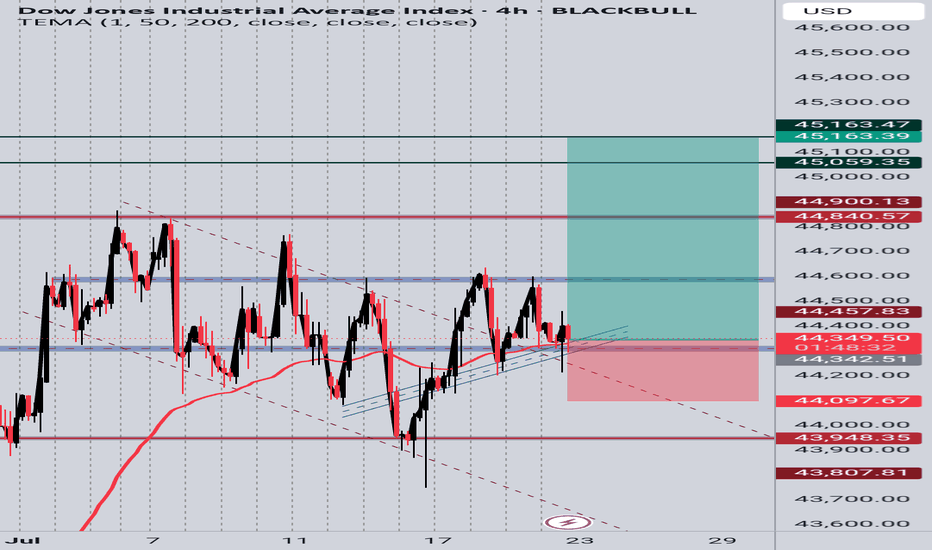
Price is respecting a rising trendline and holding above a key support zone. After multiple rejections at the trendline and EMA bounce, current candle shows bullish intent. Targeting previous resistance zones around 45,059 and 45,163. SL placed below the trendline and recent structure low at 44,097. Setup based on structure support, EMA reaction, and potential...
Gold Futures (GC1!) 1H – Bearish Rejection Setup Price showed a strong bullish impulse followed by a rejection near the 3,416 resistance zone, forming a lower high and signaling potential exhaustion of buyers. After grabbing liquidity above the previous high, it failed to hold above the zone and retraced back below a key structure level around 3,406. This setup...
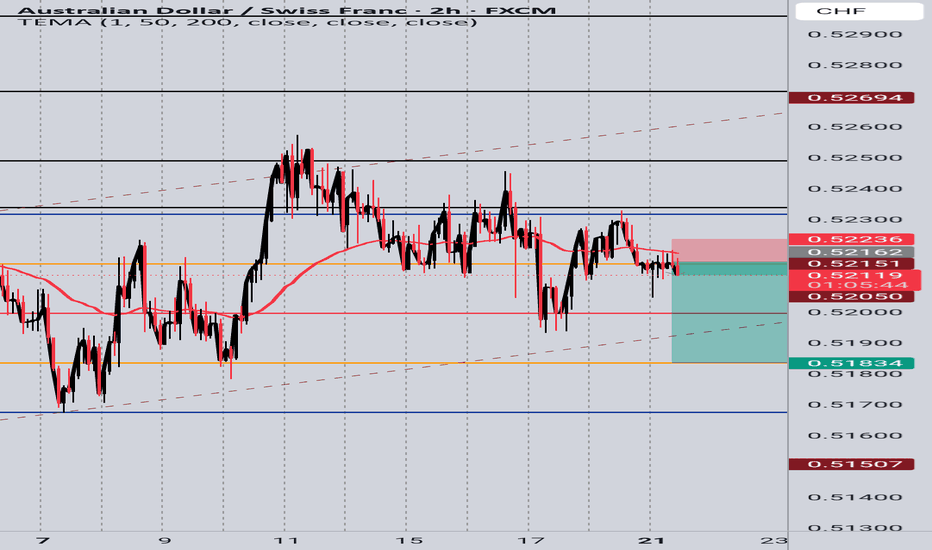
🔎 Why This Setup Makes Sense: 1.Trend Bias Downtrend confirmed — price is below both structure and moving averages. 2.Resistance Rejection: Price failed to break back above resistance near 0.5223 and left small bearish candles — showing seller strength. 3.Entry Idea: Short entry just below the resistance zone with a tight stop above recent minor swing high...
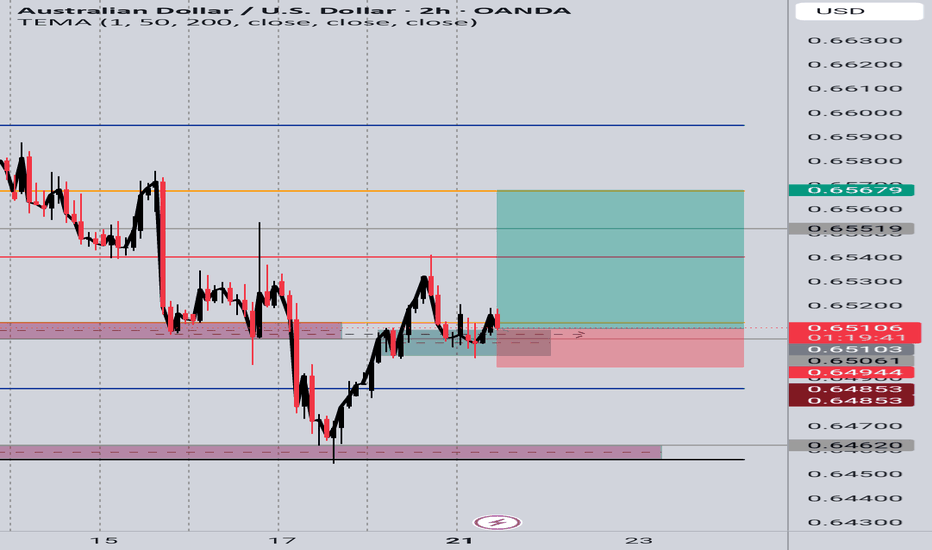
After a strong bullish push, price pulled back into a previous demand zone near 0.65000, where buyers had clearly stepped in before. The previous resistance around 0.6510 was broken and now appears to be acting as support — a classic sign of a break and retest. The current bullish rejection candle near the zone confirms buying interest. ✅ Entry: Around 0.6500 ❌...
Price is currently respecting a descending channel after rejecting the 68.00–68.15 resistance zone. We've observed: A strong bearish impulse breaking key structure. Retest of a previous support now acting as resistance (66.94) Downside targets around 64.00, and possibly extending to the 59.50–58.90 support zone.
📆 Timeframe: 4H 📈 Type: Long (Buy) 🎯 Entry: Around 3348-3355 🎯 Target: 3451 NOTE: Price has respected the ascending trendline from early July. Clean breakout from a consolidation range after several rejections near 3365 resistance. Bullish structure confirmed with higher lows and higher highs. Fibonacci levels and support zone at ~3344 are holding...
Expecting drop on BTCUSD targeting the areas as mentioned in the chart
Everything provided aiming both long and short-term

