melikatrader94
PremiumWhy did I say to cancel the last position? because gold is in the critical area! Price is testing a key resistance area around 3374. If it breaks above the first resistance level, we may see a bullish continuation toward the second breakout line. If both levels are broken and retested successfully, the path toward the supply zone at 3430–3440 opens up....
Hello guys! We're currently seeing strong bullish momentum on EMAAR, trading around the 15.35 zone. 🔎Key Zones to Watch: ✔Former Supply & Demand Area (15.15 - 15.00) This zone is now acting as a strong support. Price dipped into it and showed clear signs of buyer pressure, a solid area to consider long entries if price revisits. ✔ Flip Area (14.45) Previously...
What I see: Chart Patterns (Head and Shoulders): The chart illustrates a classic "Head and Shoulders" pattern. The left shoulder, head, and right shoulder are formed, and the neckline (the blue dashed line) has been broken, which suggests that the price could rise towards the target zone above the broken neckline. Target Price: Based on the pattern and...
Hello guys! We have a clean Head & Shoulders pattern forming near a supply zone, with a nice QML (Quasimodo Level) rejection confirming the bearish bias. Price is struggling to break above 115K and has already reacted to the QML zone. If this structure holds, we could see BTC start a new bearish leg 📉, first targeting 114K, and eventually reaching the demand...
Helloooo! Gold, after gapping up strongly, has now entered the green QML (Quasimodo Level) supply zone at roughly 3,380–3,390. This zone has acted as resistance before, so a reaction here makes perfect sense. What I see: Engulfed Level (3,315.66): Earlier support that got taken out. This is our logical pullback target once the QML zone does its job. ...
Hello guys! Bitcoin has officially broken below the descending channel it was stuck in for weeks. Right now, price is pulling back to retest the broken channel, which is now acting as resistance around the 114,700 zone. What I'm watching: Broken channel = bearish signal Retest zone around 114,700 Downside target near 110,400 So far, it looks like a...
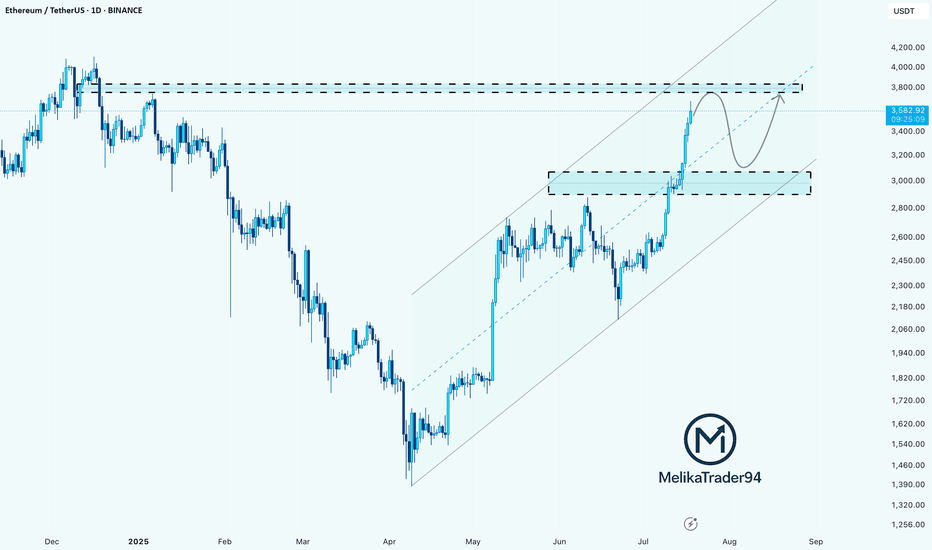
Hello guys! Ethereum has been rallying strongly within a well-respected ascending channel, pushing past key levels and now approaching a major resistance zone around $3,900–$4,000. According to the chart structure, it looks like price could soon react from this resistance, leading to a pullback into the $3,000–$3,200 demand zone, which aligns with the midline of...
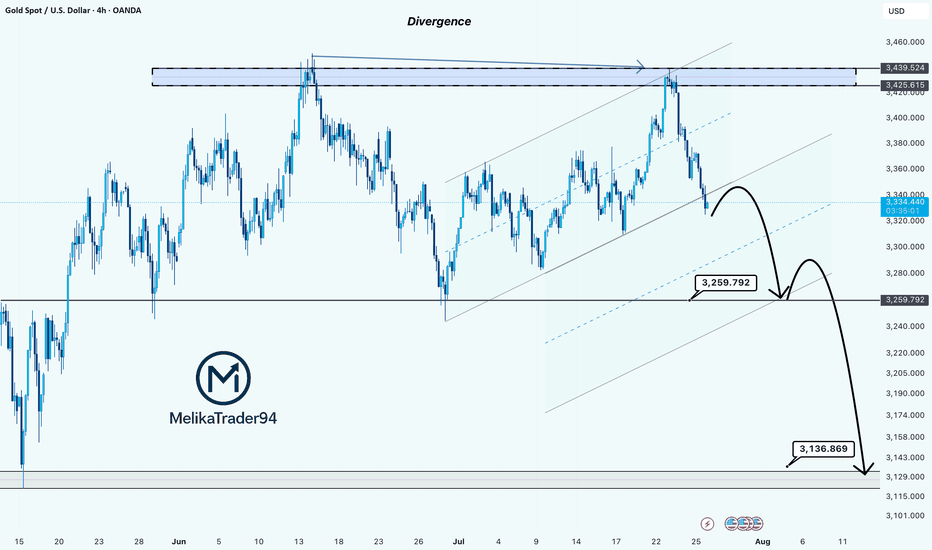
Hello Guys. Gold has reached a major resistance zone around 3439–3425, which has already acted as a strong ceiling in the past. The price tapped into this area again, forming a clear divergence, and failed to break higher. Here’s what stands out: Divergence signals a weakening bullish momentum at the top. The price rejected the resistance and is now...
Hello guys! USD/CAD has broken out of a clear triangle formation, signaling strong bullish momentum. The breakout above the top line of the triangle, supported by earlier bullish divergence, confirms that buyers are now in control. Triangle breakout confirmed Strong bullish impulse post-breakout Retest of the broken trendline expected Target: 1.38791 ...
Hello guys! btc is running in a descending channel! However, the upper level is broken up, but it could reach the upper level after a drop here! I am not sure about this analysis! What do you think about it?
Price has engulfed the DP and is now pushing higher. Based on the current structure, it looks like ETH wants to hunt the liquidity resting above the $4,080 level. After grabbing that liquidity, we might see a sharp reversal back down toward the MPL, which sits in the $2,100–$2,500 zone. This area is a strong demand zone and also where the most pain would be felt...
Hello guys! After months of climbing steadily along the ascending trendline, EURUSD has finally broken below support. The trendline breach, followed by a tight consolidation (yellow circle), hinted at a loss of bullish strength, and now the breakdown is in full motion. Broken ascending trendline Clear rejection after retest Bearish continuation underway ...
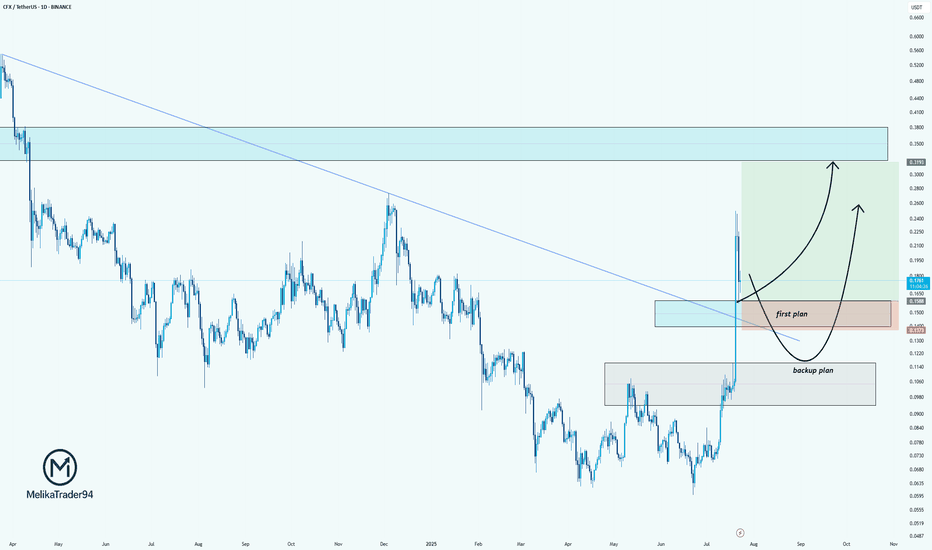
Hello guys. CFX just broke out of a long-term downtrend line, showing strong bullish momentum. After this sharp impulse, we're now patiently watching for the pullback zone. Here’s my plan: ✔ First plan: Looking for a reaction around the breakout retest zone (0.1500–0.1300). This is the ideal area for a bullish continuation if buyers step in early. ✔ Backup...
Hello guys. Divergence: A bullish RSI divergence is noted, price made lower lows while RSI formed higher lows, signaling a potential bullish reversal. Price Action: Price has bounced strongly from around the 1.3570–1.3580 zone and is now approaching a descending trendline resistance. Trade Setup: Entry: 1.3718 Stop Loss: Below the breakout candle, near...
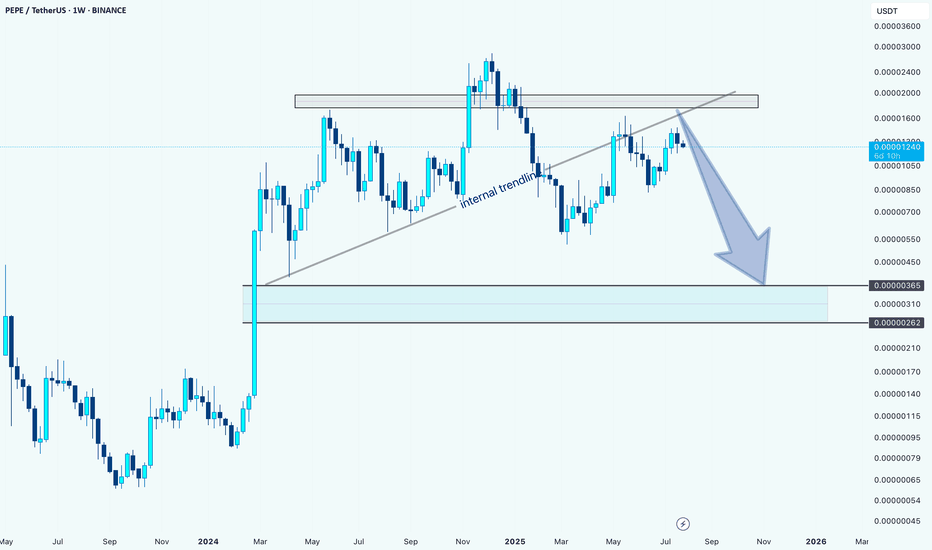
Hello guys. PEPE has tested the internal trendline multiple times and finally broke below it, signaling potential weakness. Price also failed to reclaim the key supply zone above. Internal trendline broken Rejection from a key supply zone Potential move toward the demand zone around 0.00000262–0.00000365 Unless bulls reclaim the broken trendline and...
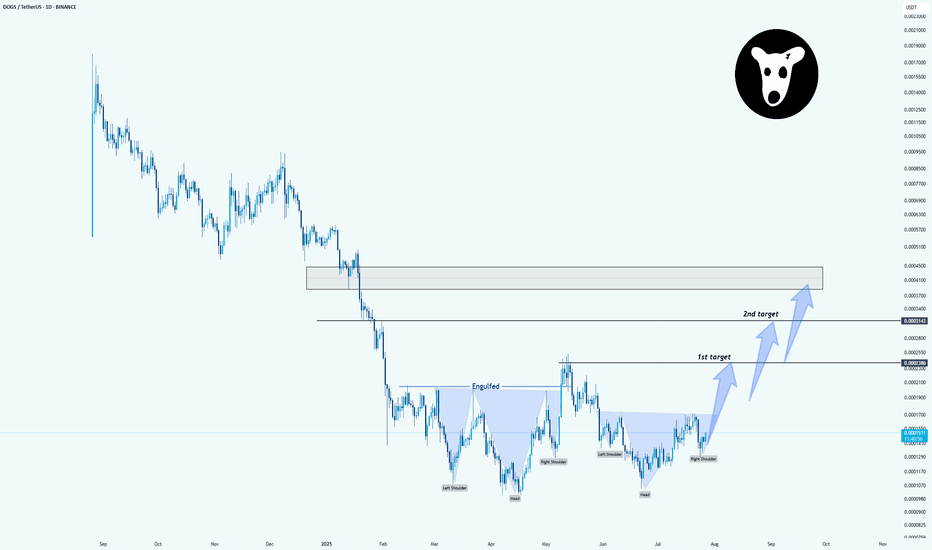
Hello. The chart clearly shows an inverse head and shoulders formation. Price has now formed: Left Shoulder Head Right Shoulder (recently completed) The neckline was engulfed after a strong move, which adds confidence to the breakout potential. If the price continues to hold above the right shoulder and gains momentum: First target is around the 0.0002280...
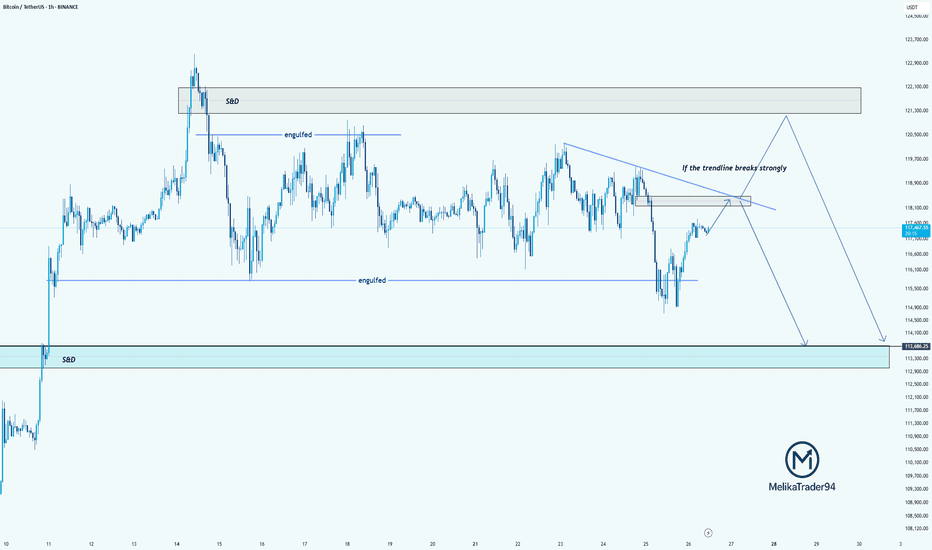
Hello guys! Bitcoin is currently approaching a key decision point. As highlighted on the chart, we’ve got a descending trendline acting as strong resistance. If this trendline breaks with strength, we may see price push up into the supply & demand zone around 121,000–122,000 before potentially reversing. However, if the trendline holds, this current move could...
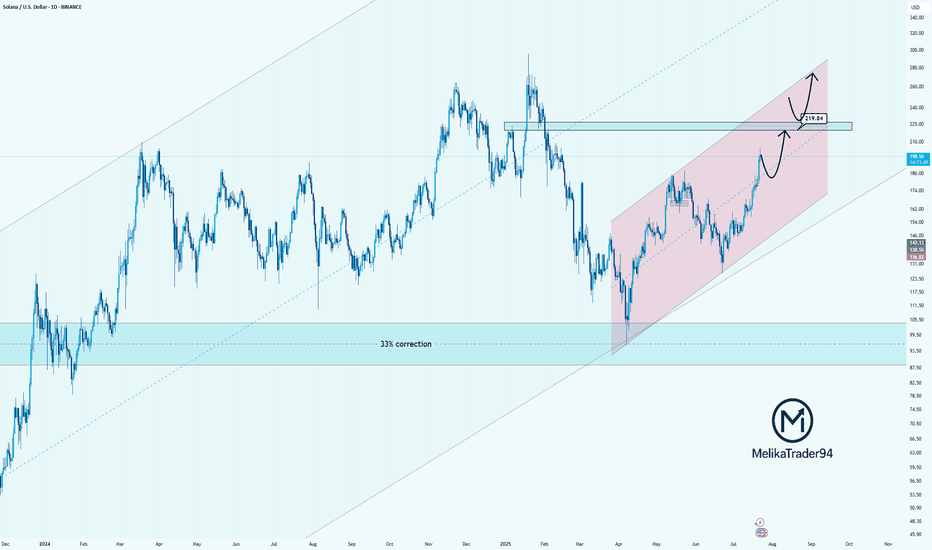
Hello guys! Solana has been trending strongly inside a rising parallel channel, recovering steadily after a significant 33% correction. The bullish momentum is clear, and the price is now approaching a key resistance zone near $219.84, which previously acted as a major turning point. Here’s what I’m watching: Strong uptrend within the pink channel shows...


