Canopy Growth Corporation (CGC) Investment Analysis (1–3 Years) Executive Summary Canopy Growth Corporation (NASDAQ: CGC) is one of the most recognized players in the global cannabis industry, having experienced a dramatic rollercoaster ride over the past years. The stock peaked during the 2018 cannabis mania, only to lose over 99% of its value by now,...
1. Fundamental Analysis Financial Performance & Profitability Regional Health Properties (“RHEP”) is a small self-managed healthcare real estate investment trust focusing on skilled nursing facilities and long-term care properties. In 2024, the company generated approximately $18.3 million in revenue, but only about $0.16 million in operating income, effectively...
LightPath Technologies Inc. (NASDAQ:LPTH) stands at the precipice of a transformative era, leveraging its proprietary optical technologies to capitalize on booming demand in defense and commercial imaging markets. With a unique Chalcogenide Glass solution displacing costly germanium, accelerating government contracts, and a strategic pivot toward high-margin...
The meme stock phenomenon has erupted several times in recent years: in the 2021 wave, the share prices of GameStop (GME), AMC Entertainment, and other small-cap companies nearly exploded almost unexpectedly due to the coordinated buying by the Reddit / r/WallStreetBets communities. A March 2025 analysis finds that the essence of meme stocks is that retail...
Analysis of Gold Resource Corporation's Back Forty Mine Tokenization Potential Introduction The Gold Resource Corporation (GRC) acquired the Back Forty project in Michigan through its purchase of Aquila Resources in 2021. Despite significant gold, zinc, silver, copper, and lead reserves, the project has faced decades-long regulatory challenges. This analysis...
GORO's Financial Restatement Analysis: Potential Impact on Future Earnings Gold Resource Corporation's (GORO) accounting error correction presents an intriguing financial situation that warrants deeper analysis. The company's apparent misclassification of a $30 million advance payment from the Back Forty project's streaming agreement has significant implications...
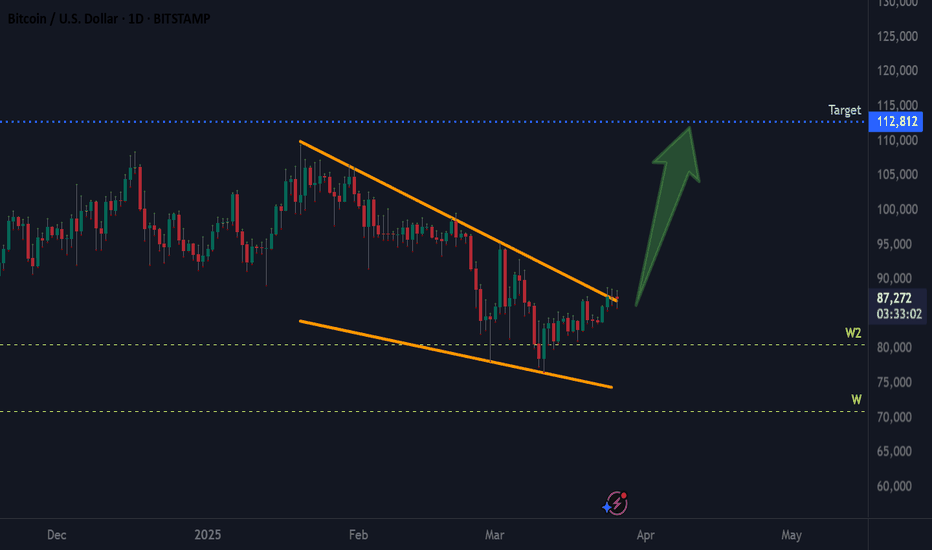
Comprehensive Market and Investment Analysis of BTCUSD - March 2025 The Bitcoin is currently trading at $86,988, representing a 0.54% decrease from the previous day's closing price. Over the past year, its price has ranged from $49,121 to $109,115. Currently, it is trading below the 50-day moving average but above the 200-day moving average. Analysts predict that...
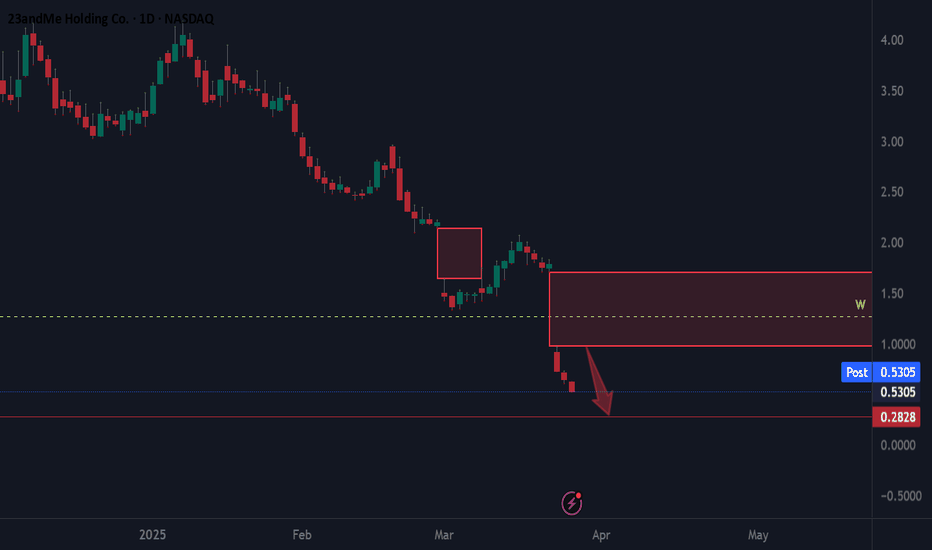
23andMe Holding Corp. (ME) Financial and Investment Analysis 23andMe Holding Corp. is currently in a critical financial situation, having filed for Chapter 11 bankruptcy protection in March 2025, and its CEO, Anne Wojcicki, has stepped down. The biotechnology company once had a market capitalization of $6 billion, but by 2024, its value had plummeted to just 2% of...
Technical and Sector Analysis of CPS Technologies Corp. (CPSH) CPS Technologies Corporation shows promising growth in several areas while technically being in a consolidation phase. The company underwent significant transformation in the fourth quarter of 2024, successfully replacing its expiring military armor contract with new business areas and having several...
Comprehensive Financial Analysis and Stock Price Forecast of iRobot Corporation iRobot Corporation, the globally recognized consumer robotics company, is currently undergoing a significant transformation period. The company's financial performance, market position, and future prospects deserve considerable attention from investors. Despite challenges in recent...
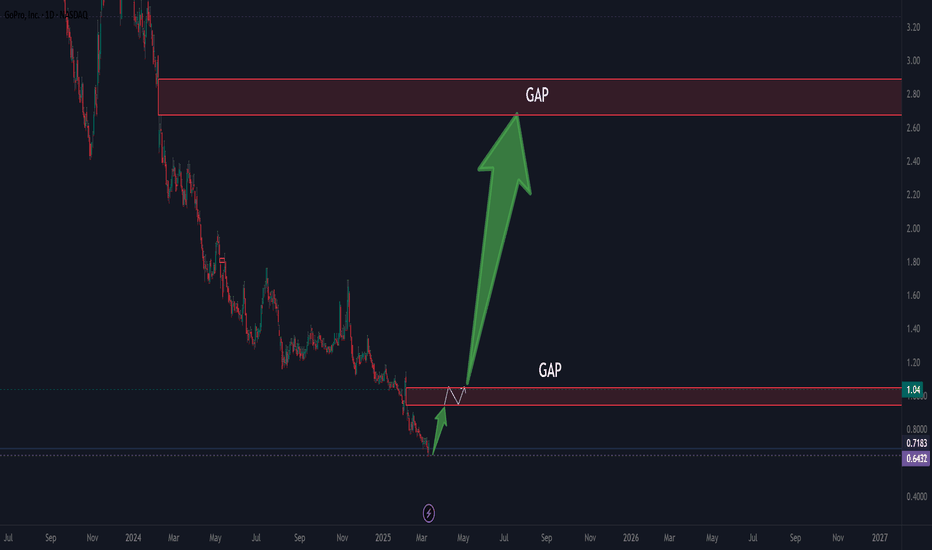
GoPro Poised for a Strong 2025: Tariff Impact, Cost-Cutting Measures, and Market Dynamics Summary: GoPro (NASDAQ: GPRO) is set to emerge as the biggest beneficiary of the new U.S. tariffs on imported electronics. With key competitors such as DJI and Insta360 facing significant cost increases, GoPro’s pricing advantage could lead to market share gains....
Arbe Robotics Inc. – Comprehensive Market Analysis Corporate Profile Arbe Robotics Inc. is an Israeli company based in Tel Aviv that specializes in the development of high-resolution, 4D imaging radars for the automotive industry. The company prides itself on being a global leader in “perception radar” solutions, claiming that its radars are up to 100 times more...
1. Corporate Profile Platinum Group Metals Inc. (PLG) is a Canadian-based mining company primarily focused on the exploration and development of platinum and palladium resources. Its flagship asset is the South African Waterberg PGM Project, a large underground deposit located on the northern extension of the Bushveld Complex. The Waterberg project, discovered in...
Analysis of the Recent Significant Increase in Gold Resources Corp (GORO) Introduction Gold Resources Corporation (GORO) has experienced a remarkable surge in its stock price in recent times. Several factors may have contributed to this rally. In the following sections, we examine market trends and investor sentiment in the gold and mining sectors, the company’s...
Arbe Robotics is a company developing a 4D microwave sensor. These sensors are currently 100 times more accurate than conventional LIDAR sensors. Their main application is in the automotive industry, including self-driving systems. Microwave devices provide more stable and accurate environmental object detection than self-driving technologies with video or LIDAR...
The fundamentals of RHE have not changed........I continue to see it as a strong MEM stock. One of the many characteristics of MEM shares is intraday liquidity. An elevated intraday trading volume should be quickly satisfied by market makers. In the event that this is not met for some reason, the price movement of the stock can suddenly take on extreme values....
PLG 500% rise ahead. PLG is a Canadian-based palladium and platinum mining company. The company owns one of the world's largest palladium deposits in South Africa. This palladium deposit is located in Waterberg County. It is located close to the surface and can therefore be mined at low cost. PLG's subsidiary PTM holds all the mining licences from the South...
XAUUSD could rise 80%. The technical picture shows that gold is about to exit an accumulation phase. It can also be seen that the size of this accumulation phase is the same as the previous accumulation phase, which also started a significant rise. In other words, two pairs of fractals are visible. The second fractal is now being built. Its target price could be...


