mikeram1971
PlusThe placement of the upper trendline in NFLX seems to indicate either price containment in an upward trending wedge, or Daily price action escaping the wedge. Either way, appears the old Weekly candle is going to be important. Above, looks like there is room. One thing, we were not strongly rejected. I'm leaning bullish, at least back to the earnings Prices. Let's...
I have looked over several charts tonight, taking a look specifically for Tickers on the Weekly with a green upweek this week. Coincidentally I had the 200 MA turned on and started noticing how Price on a lot of things really on their Weekly charts have had this problem. A problem of being stuck underneath the 200 MA for quite some time now. What is beginning to...
I start a lot of trades out by looking at the 30m chart to see if it appears to be doing something "new", very much like CAT did today. She finally got the squiggly lines in a nice and tight formation and made haste to start closing time periods higher. As much as I really feel psyched out by the slow grind, I really had to fight myself to just hold this...
Steep angle on this incline. Unprecedented. Interestingly low volume, say compared to the 2009 issues. That was an intense period of time. Even with the steep angle, it sure doesn't look euphoric with this anemic volume on Green quarters even - compared to 2nd quarter 2007 volume. And wouldn't you say there's more capital available now? What gives? No sign of...
Seeing as how we apparently did not get any Weekly chart follow through, I thought I would take a look at buying NKLA at lower prices. Found some trendlines, stacking with support levels and average price indicators, here is where I'd look for trying to buy low on NKLA.
Interestingly low volume but hard to argue with Price closing below the prior Weeks candle and into the gap she goes. Watching...
Seems like the bag holders from above the gap were not drinking the same kool-aid. About the only thing TWOU has done consistently is lose money. Result, got close to $50 and bailed. Looking for it to visit prices just a bit lower. Selling Puts at prices using a stack of the lower Bollinger Band and at first approach of Support.
I was considering adding some Health Care staples back into my Long Terms where I am very tech heavy. I started looking around a little today and found an interesting name that I may watch closely: ANTM What do we know about Anthem? I drew a few lines, and then got to thinking about a Put Sale. Any advice / feedback on something like this? I probably will not take...
I am sure that everyone and their uncle could spot this one, which probably means it fails, or still has trouble moving outside the higher trendline. But I do like trading breakouts of the ascending triangles, and I will be anxious to see what the Markets and DataDog DDOG gives us next week...
There's maybe better examples, but sometimes one is just kind of staring at you. Now do your own analysis. They don't just run up forever, now do they?
On the weekly a nice resting spot for Ford ($F) could be the low of these breakout candles on the Weekly from back in March. Got an eye on it, but nothing serious until this Weekly chart improves.
Probably not the most popular ticker in the world but I am watching for a bullish continuation tomorrow with a lean towards the Open And Go, but possibly buying the dip if she tests the 100-15m-EMA which has been recently a common theme on her chart.
Well here is where the rubber meets the road. Happy for a few days, concerned the next. It's Trading Psychology 101.
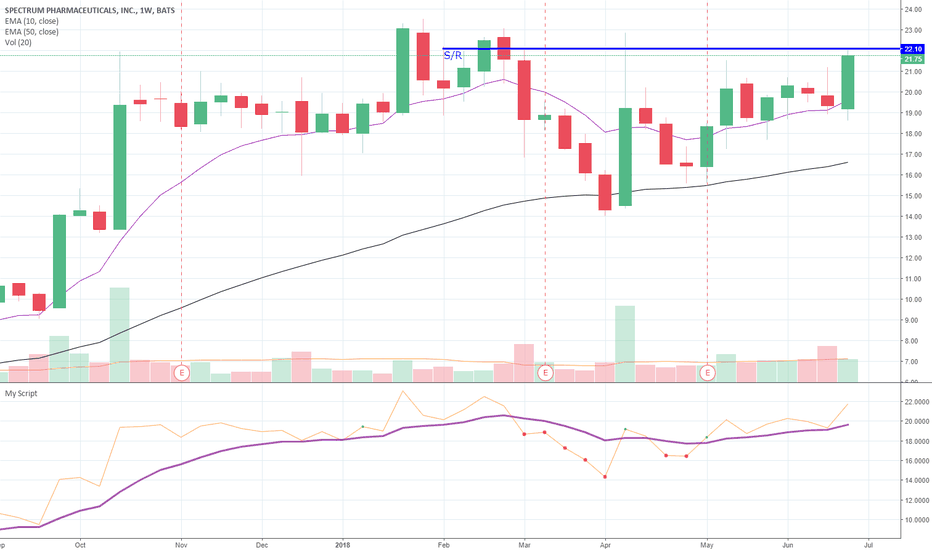
While this week is yet not over it could be worth observing how $SPPI closes out this week as she seems to be making all the right moves to take out this weekly resistance level and continue higher. I'm noticing she has been playing by solid technical moves lately, retesting breakout candle bottoms and tops, going bearish and bullish with good signals, and she...
This looks like a marked change of behavior for $CHS and could be a bullish flag forming prior to more upside on the way. You can see recent moves into this price zone led to intense sell-downs. Worth keeping an eye on at least.
Looks like a crossover of the lower-over-higher period moving average on $BB is afoot.
Looks like $MAT has twice tested this 100 period EMA on the Daily, which maybe shows enough support and after a period of consolidation a stronger move north of this position.


