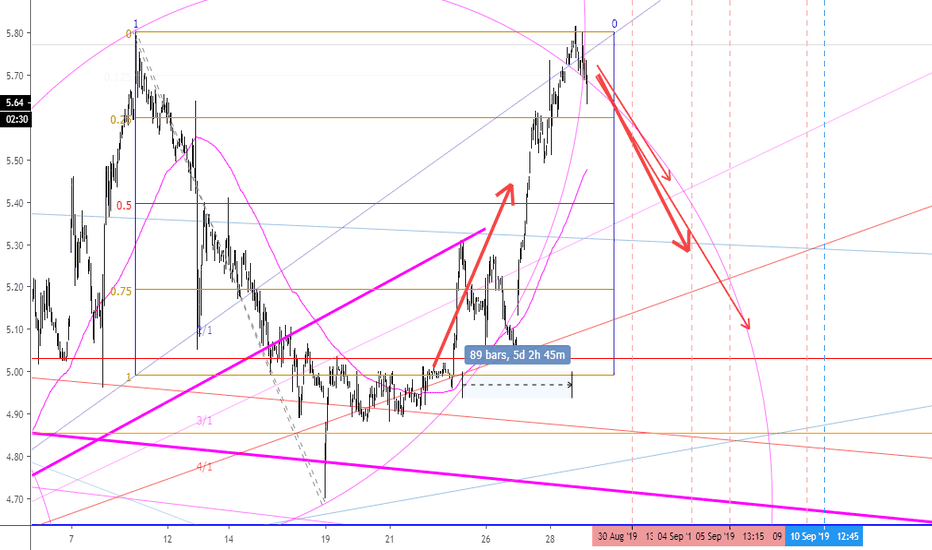
I really like this chart. I am not showing you quite everything, but you can see some fine equality between time and price here as well as fibonacci time bars in agreement. Many times I use the arcs as timing arcs, but here, use the arcs as support and resistance. Vertical lines however are in fact timing lines for mini reversal points (trading point) calculated...
I am strong believer of equality of price and time in the market, and the consistent geometric patterns all stocks/etfs/currencies follow day-to-day, and bitcoin is no exception. I am a student of market timing as a science. I do not dabble too much into cryptos, but bitcoin has been following my patterns with close precision over the last few weeks. I am a swing...
This chart is an illustration of sheer beauty and an illustration of the power when all key harmonics come together. Those of you who follow me by now probably notice that I do not post all the time. I am a swing trader, who prioritizes high probability trades that are in line with its natural cycles, but also emphasizing the equality of price and time as a...
Pretty clear distribution forming in BTC. Remember, distribution comes in AFTER a top is made. Indicators arent screaming sell..just yet. But be on the look out. Monday and Tuesday (for the Gann students) are showing to be MAJOR cycles. Time to stay on the side lines. COINBASE:BTCUSD
Short term bounce to the downside. May see a bit more consolidation before dropping. NYSE:IBM
Hitting major resistance. Can either gap up or break down to fork lines (minimum target down is the median line). Technical indicators appear to point to the downside. We will be short after a break of the signal reversal bar only. If we get upside pressure, we will only be long up to the upper forkline. Happy Trading NYSE:T
Clear triangle pattern forming before eventual breakdown to continue GE's gradual fall NYSE:GE
I have had this chart for a while but I think now I will share it. AMAT still has a little room to run on the upside to major resistance at $51.49 but is getting close to topping out (with minor resistance at $53.93). While the indicators do not signal we are there quite yet, and that there may be a week before AMAT tops, the chart pattern is getting closer to a...
Bitcoin will drop to major support at $9531. What ever price action tells us at that point will be the tell tale sign of the short term fate for bitcoin. A break below $9531 will be confirmation of a down trend (atleast in the short term) as we see higher bottoms and lower lows from July 10th to today. A bounce at the $9531 will be positive for Bitcoin, but not...
Getting close to our calculated lower support levels. May see a reversal on either of the two support levels with a bounce to the upside. If the stock breaks $92.00 expect much lower levels for HLT. NYSE:HLT
Called the top of this one to perfection in its original chart days ago. Should see a bounce down to support with some consolidation before we may see the up move proceed. Danger zone is $282.45. A break of that level and we will be short. Please note the vertical black lines as timing lines for reversals NYSE:ANTM
Looks like we may get a reversal by the end of today. Note that we are currently 61.8% retracement with a strong directional candlestick at the bottom. Looking for a potential reversal by end of day today in which our minimum upside target will be $71.46. If we break through the lower support of at the 61.80% retracement (or $70.18) to the downside> look for a...
Down assuming price breaks the drawn 50% retracement. Short term indicators confirm this (thus break of 50% level) NYSE:MCK


