The TRX price move like BTC chart. There is a similar stage! We can look for buy entry near the levels. Potential profit will be 3 times bigger than the risk. Thank you for your support!
The price is on the upward Channel. We can look for Buy entry in the zone. Potential profit will be 3 times bigger than the risk. Thanks for your support!
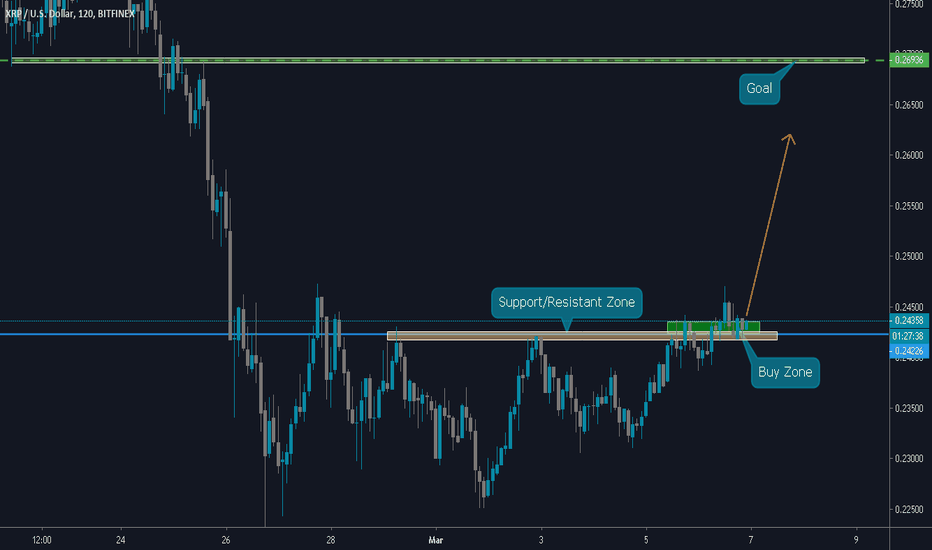
We can open a buy position. The price moved to this zone after a big accumulation. Now it can start to grow. Thanks for your support guys! I really appreciate your likes and comments!
We can open another Buy position if the price will cross the Support/Resistance Zone. I will make an update about the entry point if I will see it. Hope you will support this idea with your likes! Good luck! I wish you a lucrative trades!
As we need support/resistance, so this pair NEM/Bitcoin needs and has it too. We're waiting for a little falling of Price but near Support/Resistant Level it can collect its strength and start to grow up. Buy Zone is under the arrow. Hope this prediction comes true. Write comments and click like!
So guys, here we have Key Level, which says: wait for the changes, babe! I purpose, that price can hit off this level and start to move up. The best Buy Zone is under the arrow. Keep in the eye on the Trend Line, which pushes growing of the Price. I extremely wait for your comments&likes, guys!
We have Mirror Level, which can reflect the price and it may start to increase. The best Buy Zone is under the arrow. Wait that the price will reach 0.020003. I hope you like my forecast. I need and wait for your comments and likes!
We have two potential targets, where the Price will be moving up. Because of Trend Line, I purpose, that price will continue to bounce and run up. We have an alternative to choose the best Buy Zone. Hope my prediction will be true. Ask me questions, guys!
The Price can confidently steer to Key Level. After it can be bounced from this line and start to grow. The best Buy Zone is under the arrow. Wait for your feedback and questions, guys!
We have the Trend Line. Price can jig to this line's tune and keep growing up. Price may hit the Support/Resistant Zone and increase further. I Hope, that forecast will play pass. Keep fingers crossed and wait for your feedback.
We can see, that in these latter days, the price was accumulating and bidding up in the Triangle. When it moves out the Triangle it can start to grow up. I purpose, that the Price may reach the 23.02 and 24.02 indexes. That's our goal. I hope that the Support/Resistant Zone will further its move. Do you like my Idea? Let me know about it and write your comments!
We can keep an eye, that the Price move out the triangle, where it was accumulated some time. The best Buy Zone is under the arrow. When the Price hits the Support/Resistant Level, it can continuously grow up. Do you like my Idea? Your feedback is really important to me!
I'm waiting for an accurate buy entry above the Support/Resistance Zone. But if the H4 candle will close below we shouldn't open the position. This is a short term idea, that's why the goal will be not far the entry point. If you like my ideas I'm strongly waiting for your feedbacks! Thank you for your support. I really appreciate it!)
We have a Key Level, which means, that we're waiting for new trend. After growing up the price may a little bit move down, but then it can increasing hastily. The best Buy Zone is under the arrow. So, keep fingers crossed! Extremely wait for your comments&likes!
We have a large Support/Resistant Zone. Price approaching to this Zone again. In the Triangle, price accumulates and then, I suppose, can dropdown. The best Sell Zone is under the Triangle. I wait for your comments and likes
We have clearly Mirror Level. The price can bounce and fall down to 178.43. There is a bearish trend, so the price could continue to fall down. Thank you guys for supporting me. I hope you like my Idea. Wait for your comments&likes!


