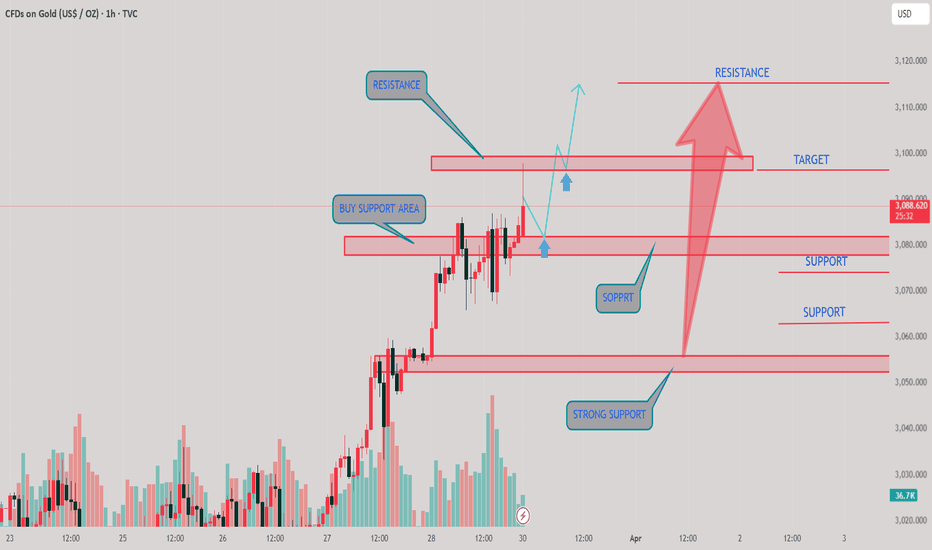
1. Double Top Resistance Breakdown The chart suggests a strong double top resistance zone around 3,160 USD. Disruption: If price tests this zone and fails again (creating a third top), a sharp reversal could occur. Implication: Bearish pressure may increase, potentially invalidating the long-term bullish target. 2. Failure to Hold the Bullish Zone Price is...
Support Breakdown: The analysis assumes that the price will respect the support level and bounce back up. However, if the support at around 149.000 is broken, we might see a further decline rather than a bullish reversal. 2. False Breakout at Resistance: The target suggests a move toward 151.000 resistance. However, price might fail to break above resistance...
Spelling Mistakes: "SOPPRT" should be "SUPPORT." Lack of Bearish Scenario: The chart assumes an upward movement, but what happens if price fails to hold the support zones? Volume Analysis Missing: Volume is shown, but its role in confirming trends is unclear. A breakout with high volume would be more reliable. 2. Alternative Perspective Possible Fakeout: The...
Potential Bullish Scenario The analysis assumes a strong downward move, but buyers could defend key support levels, especially near strategy support and double-top strong support. If the price holds above these levels and forms a reversal pattern (like a double bottom or bullish engulfing candle), we could see a rally back to sell zone and double top...
Bullish Breakout Scenario (Reversal): Alternative Idea: Instead of reversing at the strong selling zone, GBP/USD could break above the resistance level at 1.2940 and continue upward. Trigger: If strong bullish momentum emerges (e.g., fueled by positive UK economic news or weak US dollar sentiment), this could invalidate the bearish setup and turn the trend...
1. Bearish Reversal Scenario: Alternative Outlook: Instead of continuing upward to the next target, Bitcoin may fail to breach the resistance and reverse downward due to a potential "bull trap." Trigger: A rejection at or near the double-top resistance around $88,000 could initiate a sell-off toward the trendline support near $85,000 or lower. Bearish Volume...
Bullish Breakout Potential: Alternative Scenario: Instead of the bearish move toward the lower targets, the price might break through the strong resistance (highlighted at the "double top" area). Trigger: A strong bullish volume surge could invalidate the resistance zone, leading to an upward breakout toward a potential new high, around 3,050–3,070. 2. Support...
Double Top Resistance Could Trigger a Reversal The chart assumes a breakout, but a double top is typically a bearish pattern. If price gets rejected at this resistance, it could signal a strong downtrend instead of the projected bullish move. Support Might Not Hold The analysis assumes a bounce from support, but price recently dropped aggressively to that level....
Double Top Resistance May Hold – The chart assumes a breakout above the double top resistance, but double tops often indicate a reversal rather than a continuation. A strong rejection from this level could lead to a bearish move instead of the projected bullish scenario. Volume Divergence – The recent price action does not seem to show strong bullish volume...
1. Resistance Zones: The chart identifies multiple resistance levels, including a double-top resistance. However, if gold strongly breaks above the resistance, it may invalidate the bearish double-top pattern 2. Trendline Support: The trendline support is correctly identified, but trendlines are subjective. If broken, it could signal a trend reversal rather...
False Breakout Possibility: The breakout above the resistance level could be a fake-out, leading to a sharp reversal instead of a continued upward movement. A double top at the resistance level may indicate a stronger bearish reversal rather than further bullish momentum. 2. Overextended Trend: The previous strong bullish move could be overextended, leading to...
Resistance Rejection: The price is nearing a strong resistance zone (~$3,004). If it fails to break through and forms a bearish pattern (e.g., triple top, bearish engulfing), a downward move could occur. 2. False Breakout: The chart suggests an expected breakout above resistance, but a fake breakout (bull trap) could lead to a sudden reversal, trapping long...
Contrarian Perspective (Bearish Case) Instead of a breakout, the price could fail to sustain above the resistance and reverse downward. The double top formation suggests a potential bearish reversal rather than a continuation. If price breaks below the support level, it could invalidate the bullish setup and lead to a decline towards 2,900 or lower 2....
Resistance Zone (Red Box at ~$85,000) The price has reached a strong resistance level. A double-top pattern is forming, suggesting a potential reversal. There is a rejection from the resistance zone, indicating selling pressure. Support Levels (Blue Boxes at ~$83,000 & ~$81,500) If the price breaks below the minor consolidation, it may test the first support...
Fakeout Possibility: The price has sharply surged, but it may be a liquidity grab before a reversal. If buyers fail to hold above the first support zone, a deeper drop could occur. Resistance Strength: The resistance zones above are historically strong, making a breakout difficult. If momentum weakens before reaching the first target, a rejection is...
Counter-Analysis (Bullish Scenario Instead of Bearish) Breakout Instead of Reversal The analysis assumes that GBP/USD will reject at resistance (~1.3112), but if buying pressure is strong, it could break above resistance instead of reversing. A breakout above 1.3112 could trigger further upside movement toward 1.3200+ levels. Support Holds Instead of...
ounter-Analysis (Bearish Scenario Instead of Bullish) Rejection at Resistance Instead of Breakout The targets assume that price will move past resistance zones at $69-$71, but resistance could hold, causing a reversal. If sellers step in near resistance, we could see another leg downward instead of a rally. Support Failure Instead of Bounce The chart suggests...
Counter-Analysis (Disrupting the Bearish Outlook) Bullish Continuation Instead of Rejection If BTC breaks through the resistance zone near $87,792 instead of reversing, it could aim for $92,305 or higher. A breakout with strong volume could lead to a new uptrend rather than a drop. Strong Demand at Support Levels The suggested bearish drop assumes that support...


