mrsceleste
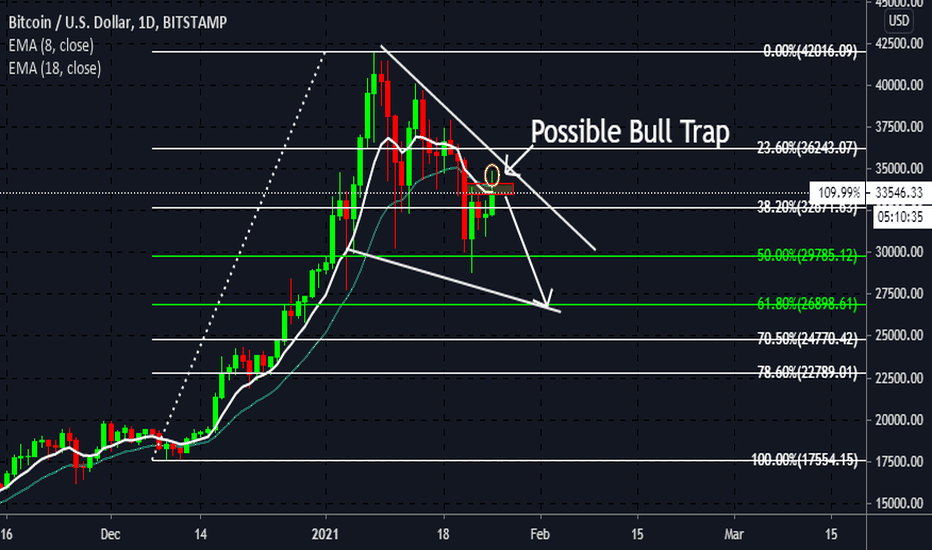
To get the context of this post, please refer to my last idea. It is of my opinion that BTC is not ready yet to re-test previous highs. Excitement of the recent Bitcoin bull rally and now the correction, leaves opportunity for excited newcomers to join in at the next opportunity of buying. As noted we see price breached the key zone noted in my last idea,...
Note key zone where price is sitting, right under the 18 and 8 EMA cross, which if price does not advance above, we could see price move more to the downside. Could we get more downward momentum to the 61.8% fib level before BTC retests the top? Studying price action; for now staying neutral. Overall trend is bullish and price consolidating within a corrective phase.
Watch for rejection at key zone. Targets as noted. Ascending wedge formation
For demonstration and educational purposes only. Overall trend is bullish on higher timeframe. Previous month selling was anticipated correction. Note price is sitting at a key demand zone, 50% of previous impulse. Trade at your own risk, perform your own analysis, and use proper risk management.
This is for demonstration and educational purposes only for those new to technical analysis and who are learning about corrections. Today's lesson is to help with mindset and controlling emotions. Don't fret about corrections before continuation. The market must correct itself after an impulse. Whether now or later, a correction is bound to happen. May not be...
For demonstration and educational purposes only. Trade at your own risk.
Target $15 or over over the next two years. Purely based on technicals using fibs and trend analysis
Price is sitting at key zone, a key area of support. A possible buy opportunity may lie ahead over the next coming weeks, although it may not be an aggressive move. Watch price action at key zone noted. For demonstration and educational purposes only.
For demonstration and educational purposes only. Price testing a key zone. This is a watch for now. Watch for rejection and re-testing of key zone over the next couple of weeks. This could offer a possible 3.500 pip opportunity. Trade at your own risk.
For demonstration and educational purposes only. Price appears to be completing bearish flag, ripening for continuation to the downside. Of particular note is rejection at key level as noted.
For demonstration and educational purposes.
Price approaching key zone; ascending wedge formation, with possible exhaustion of movement to the upside. Study price action for possible sell opportunity. This idea is for demonstration and educational purposes only. Trade at your own risk.
For demonstration and educational purposes only. As we study price action we see a flag and what appears to be a rejection on an attempt to rally/buy further. This could be the making of a swing trade. To be conservative, you can wait until this current weekly candle closes and revisit price action again.
Study price in zone noted for evidence of rejection. For demonstration and educational purposes. Trade at your own risk.
As an update to the previous linked idea below. Nice tweezer bottom formation at a key level in the markets; bullish momentum could be gaining. This idea is strictly for demonstration and educational purposes only. Trade at your own risk.
For demonstration and educational purposes. Wick Rejection; watch for break and a possible sell opportunity to the next key zone as noted. Trade at your own risk. This is not a signal.
For demonstration and educational purposes. Price is approaching a strong key resistance zone. Ascending wedge formation; watch for rejection, with anticipated TPs at zones noted. Trade at your own risk. This does not constitute a signal to buy or sell.
To note, price appears to be establishing support at a major key zone, with observed higher low price points. This idea is for demonstration and educational purposes and does not constitute a signal to buy or sell. Trade at your own risk.


