murattpics
If we close below 5000, we can see more downside towards 4200.
We can look for possible shorts if that doji candle breaks down.
We can look for shorts if that weekly doji candle breaks down. If bears are able to successfully defend this key resistance we could see a move down towards 5100. If not a continuation towards 6150 is likely.
GBPUSD has formed a descending triangle, now its sitting at support and has formed an Inside bar (red arrow) Should this support fail to hold, a continuation towards 1.2800 is likely possible. If bulls on the other hand can gather enough strength to defend this support successfully, it’s possible we see another leg up towards 1.3300.
Keep in mind that any oil shorts are counter-trend trades. Better is to wait for a false break to occur on a 4 hour TF.
Should bulls be able to quickly push price back above 0.6730, we’re likely looking at a false break setup, but if bears are able to stay in control, a bearish continuation down towards the next key support in line is likely, which can present potential shorting opportunities to bears.
Following the very strong impulsive selling in Q4 last year, which took the pair roughly 2300 pips lower in a couple of months, price has been pulling back correctively and is now closing in on the Long-term key resistance around 1.96-1.98. This is still a waiting game for now. But the longer GBPNZD consolidates, the more appealing the breakout potential...
Bitcoin broke out to the upside of the tight consolidation in late March followed by very strong buying and we’re now approaching a major key resistance zone. Trading below 6400 and bears looking for potential shorting opportunities can look for possible locations around the key resistance. A break and close above this key resistance would put 7350 and 8400 back...
The Swiss market index is now again testing a the major multi-year resistance around ~9 500 which in the past has produced multiple strong rejections. Potential Short-term/Intermediate-term bearish plays from this resistance. Lower timeframe for possible entry.
After trading roughly 11 months below the multi-year S/R zone, bulls have now successfully pushed the price of this precious metal back above the key resistance, which is now being tested as support. Trending Analysis The current pullback should be of interest to bulls as it can offer potential buying opportunities in anticipation of a possible bullish continuation north.
Taiwanese company Hon Hai/Foxconn, known for playing a major role in assembling Apple’s iPhones but also a bit supplier to most of the world’s gadget makers. Foxconn is the world’s largest contract manufacturer and one of the largest private employers in China (if not the largest), and is one of the largest tech companies in the world (at least on a revenue...
Ra Pharmaceuticals to Present at the RBC Capital Markets 2018 Global Healthcare Conference Ra Pharmaceuticals, Inc. (RARX), a clinical stage biopharmaceutical company focusing on the development of next-generation therapeutics for the treatment of complement-mediated diseases, today announced that Doug Treco, Ph.D., President and Chief Executive Officer, will...
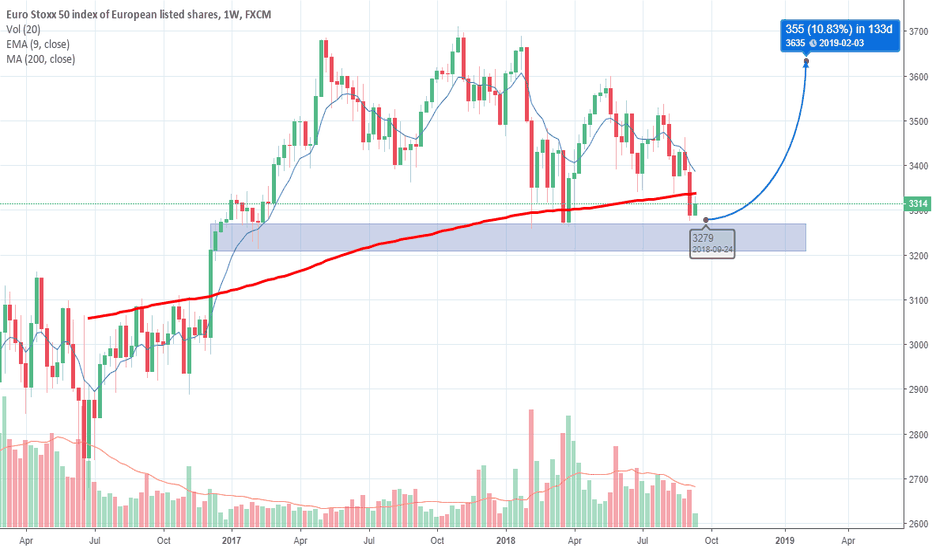
Key Support & Resistance Levels R: 3660 – 3710 S: 3210 – 3270
NZDUSD – Testing Key Support (Weekly chart) After an initial bounce from the key support zone (0.6780 – 0.6870) in the middle of May, price is now re-testing the LT support zone a second time. My bias for this pair is neutral which means I’m looking to trade both sides of the market. Thus traders can look to buy the bottom and sell the top of this range as long...
symmetrical triangle formed GBPCAD, set your stops ready.


