Does anyone have an idea on what could have caused this movement? the funny thing is, its only visible on trading view chart and not on meta-trader 4 Kindly share you views and don't forget to follow.
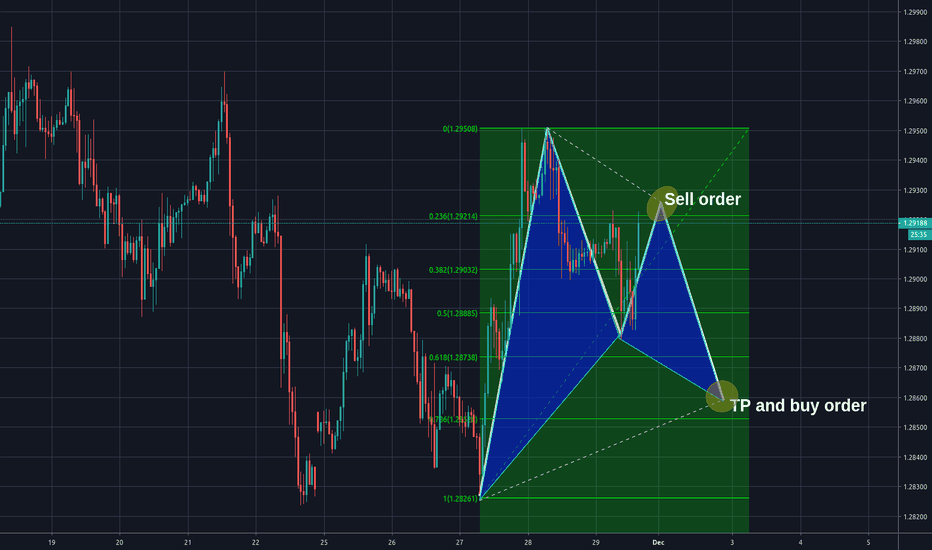
There is a potential gartley pattern formation. Don't forget to follow and we will keep you ahead of the market.
This strategy still holds as long as the market is bellow 0.786 level of the fibonacci retracement. Should the market brake this level then we will get into a buy order. We have the complete Harmonic pattern. Don't forget to follow for more analysis and we will keep you ahead of the market.
The strategy still holds because the prices closes below 1 on the febo retracement. should the market close above 1 level then we will buy. from the position now we are making a sale don't forget to follow for more updates and will keep you ahead of the market.
Potential Harmonic pattern. To stay ahead of the market, Don't forget to follow.
There was a false breakout. We expect the market to make a pull back touching the trend line.
There is a clear formation of the "W" pattern which edges have tested the fibo numbers.
There is a break from the triangular pattern Use a Stop loss just in case the market reverses, which is also very likely
There is a break on the resistance line. upward trend. break from the triangular pattern.
The market is on a down ward channel. The market is gonna touch the resistance line and bounce back
We have a support line that had been broken earlier and is now going as resistance. I see the formation of a triangle pattern. There is a general upward trend.
We have a triangle pattern here and its my hope that the support line is going to be broken.


