BTC - Bearish falling 3 methods forming on the 4 hour indicating possible reversal to the south-side. Best to keep an eye on this fellow as this setup looks highly suspicious.
This sure looks to me like the Bear Trap mentioned earlier in the chart below playing out. A target in the 21 to 20k area will be possible target zone.
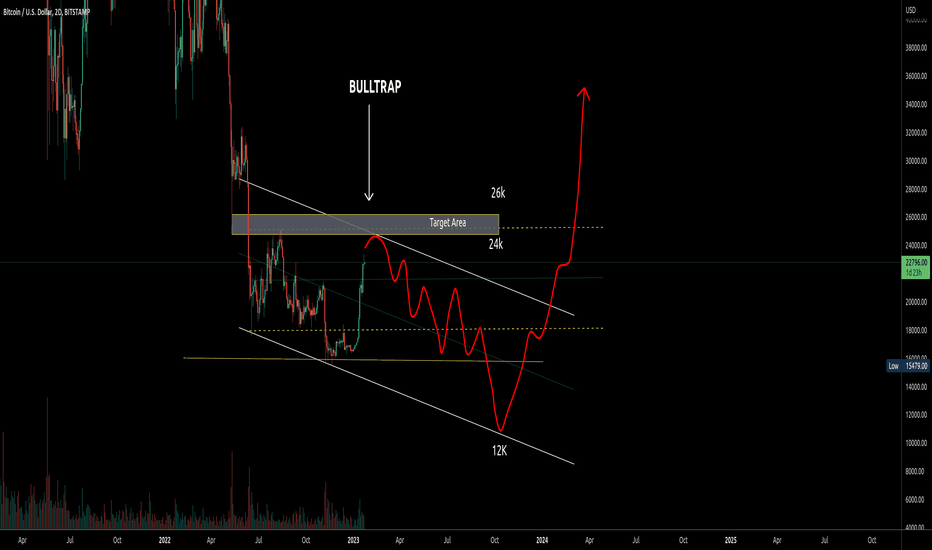
BTC - Possible Beartrap / Bulltrap brewing . Possible Beartrap in play as Id expect BTC may still touch the 25k area or slightly above before we see an actual retrace lower .
BTC - This looks like a Bulltrap and I'm expecting a move back to the 12K zone or lower. On the other hand Id be bullish if this run continues upwards and 27k is cleared and retested ; However I've a suspicion BTC will not make it to the 27K area and will retrace long before it reaches this area.
if the wyckoff phases A through C are drawn on the chart then this looks like a Descending wedge to me . This would also be an accumulation pattern and my thought is the eventual target is going to be the dashed yellow line at the bottom of the chart at around the 12380 zone.
Things could possibly get challenging at the 18590 area. This is because a close look at the area marked "Area of interest" shows BTC is approaching the top of the trading range . This is also the area marked as "Ultimate target" in the first graph below Looking closer at a larger picture it shows that this is also a series of trading ranges as shown below
BTC - Looks like a strong move incoming to exit phase D and push upwards. This graph is also a continuation of the setup explained in the graph below, To protect liquidity should things backfire stop for longs should be set at 16700
If this area is looked at as a local Wyckoff re-accumulation range then BTC could be in a Trading Range which goes from 16805 to 17248. If the wyckoff phases are also drawn in then BTC can also be said to be at a Local Wyckoff phase D. A Wyckoff Phase D is when then asset prepares to exit the top of the trading range. Hence If this is indeed Phase D ...
if the wyckoff phases are added to the charts from 2019 and 2022 these setups appear Similar... which looks very suspicious if you ask me . if this is the case then id expect the next move to be a failed spring in 'Phase c ' where BTC fakes a bear trap move lower and the shoots back upwards towards the top of the range at 18K How can we tell if this not that...
This looks like BTC is in a local re-accumulation trading range which goes from 17249 to 16733. There has currently been a rejection at the top of the range at 17425 and BTC has fallen back into the trading range. if the wyckoff phases are drawn in then this would be a local phase B and id expect BTC can move to the bottom of the range at around 16733 before...
This is a continuation of the chart below . A look on the second chart in that graph shows BTC is now exiting the top of the smaller trading range (trust me it helps to click through and understand what the whales are up to ) The aim of the market makers is to test the top of the trading range as was explained in the graph below
The "area of interest" is a smaller trading range inside a larger trading range . if BTC moves down then I'd expect BTC to briefly exit out of the smaller trading range at around 16200 and push back up .. Something similar as shown in the graph below . As long as BTC remains above 16100 I expect BTC can push higher to the 17k area. if BTC falls below...
I think this is a bear trap as under wyckoff this move down is still a SOW ( sign of weakness) and the next move should be a move up to test the 17868 area.
if this is really a Wyckoff phase C spring then the next move will be a strong push to the resistances at 17505 and 18891 followed by movement to 21955. On the other hand If this is not a phase C spring then id expect a rejection at one of the the resistance areas 17505 , 18891 or 21955 followed by BTC moving down to the 14700 area. For now its best to...
XMR - Possible move down to 77 . if 77 fails to hold as support net move down will be to 65.
LINK appears to be heading to the support at 4.5. Should 4.5 fail as support the next level down will be 2.0
The 9 Day candle shows the MA50/150 and the MA20/200 are going to cross as was mentioned earlier on the chart below. When this occurred last time there was a sharp move downwards. As this is a 9 day candle the impact of this bearish cross would be felt towards the last week of November which is also around the "Black Friday " sale date. In addition ...
18700 is strong resistance and expecting a rejection at this location should BTC make it that far. Anywhere along the dashed green line is considered strong resistance and when BTC hits this line id expect to see a rejection On the other hand a close above this 18700 location is a good sign


