myricka0203
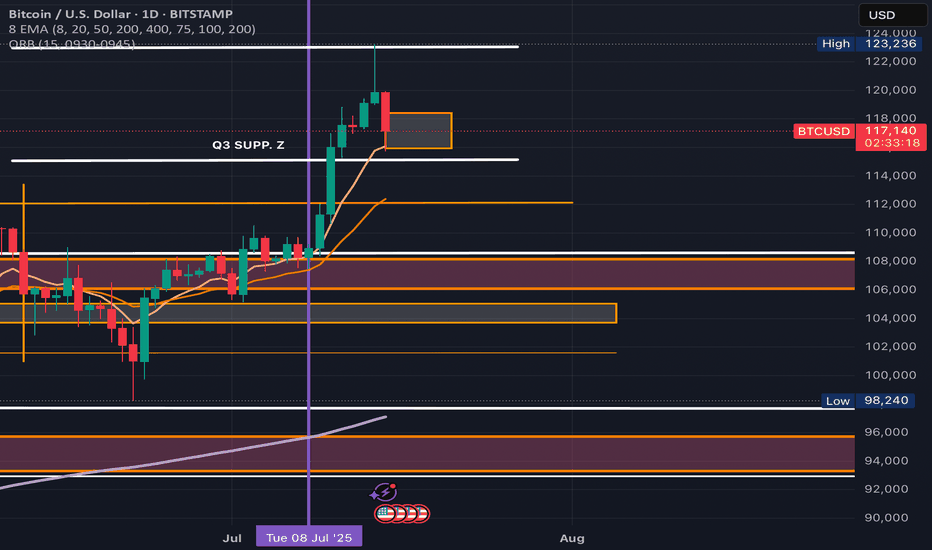
Currently looking for clear confluence this week before BTC returns to 120k. Projected Consolidation and Accumulation for 7/16 and 7/17 and looking for a break above around 118k-119k. To load up before the next project hi (key lvl)
All correlation with each time frame presenting possibilities of a downtrend to a previous support around 1900. Lets see :)
Monthly wedge presents an upcoming breakout with potential poi. December price action presented a formation indicating a daily uptrend towards the monthly hi. ( will it break the monthly resistance )? With new higher highs presented since then, price now sits around the 50line presenting monthly consolidation towards a breakout. ( will it continue to the downside...
11-14 presented a 1H downtrend indicating loss of buying buying pressure. Reetracemnt confirmed entry based off confluence between break of structure and ema crossover.
The 4h chart presents a potential entry on the downside! The 4h chart also shows price reaching to a key area indicating a potential sell. With the 4h bearish diversion trend line and extra confirmation on the RSI, it shows value losing strength. The daily chart also shows price action below the same key zone area, indicating a potential sell entry. hope this...


