naumchuk0607
Short and simple. Next bull run we looking for 103k, but before that, as low as 34k. 45300 is a daily level, and likely to get a short term bounce, or basically just a reloading point. When BTC breaks below the wick of 42k, watch the zone from 38k to 37300 for a momentary bounce. I would like to see BTC fall a bit after that as well; below the 0.34 fib zone to hit...
Honestly never seen this before. 2 fib channels, 1 fib extension, and a fib time zone all point to 50000 BTC in 12,5 hours after this post goes up. If this holds true, literally an hour before the New Year we will see BTC starting to make its way down. 2022 will start off bloody. Check out my previous idea for a much longer term time frame (one that has been...
Historically, when bitcoin has entered a bear market, it follows a descending triangle that eventually breaks down. The question now is wether this will happen once again. Looking at the descending trend line, Bitcoin has almost perfectly rejected it. We also have the fib from the high (65k) to the low (28k) where it stayed under the .382, a crucial zone that...
Most likely: bounce at 42-44k. What is 99% going to happen: continued slippage. Surprisingly enough(or not), the bars pattern from the most recent dump lines up almost exactly. Great bounces on these fib lines so far, with historic levels from Jan 8, Feb 25, and Feb 28. Will we break lower than 42k? Its very unlikely so I won't bother covering it here but some...
Look at this chart of the February dip. Fib lines hit perfectly, and we received a bounce from bottom red line(29.8) to (61.8) line. So far, this sequence looks exactly like it, and if we assume that this is in fact a similar sequence, then we should expect 46300 to be the bottom and the next high( in about 24 hours from the low target) to be 55k. Take profits there!!
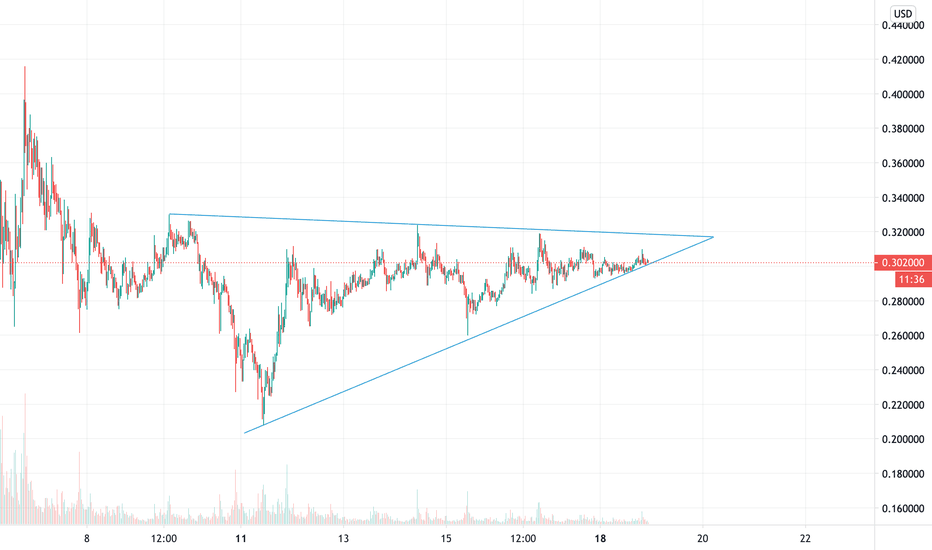
If Bitcoin can rise back into the ascending triangle, we will see it rise all the way to the upwards resistance point, much like we just witnessed XLM do exactly the same thing yesterday. If this happens, XLM will also test its resistance point and more than likely break it ( since it is so close to the support line right now). But, things aren't looking good...
Looks like stellar ( XLM ) is headed in an ascending triangle , testing a break out point that will more than likely head into a new all time high. All it needs to do is break 0.324 ...


