oe123
Simple and sure. Symmetrical triangle pattern with shorting opportunity.
Eventual shorting opportunity coming soon.
Price can break above the resistance line or support line of pattern.
Broadening wedge descending leans towards a bullish bias at 72% but of course at times price can break below the pattern as well. In this chart you have 72% for the upward break above the pattern and an 83% chance to make the measured price target.
While the symmetrical triangle pattern currently holds the price action, I give this a bearish thumbs up!
The widest part of the pattern projected downward provides a potential profit target. The key word here being "potential" as targets may be exceeded, reached, half way reached or not at all. I give this a bearish thumbs up.
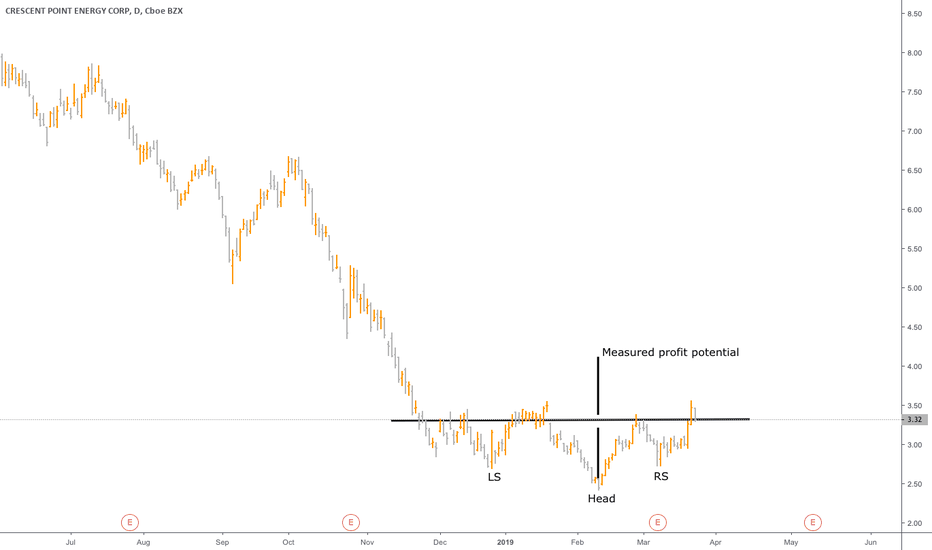
Up up and away! Nearing a bottom at 5 years you have an inverted head and shoulders pattern which is a bullish bias. To get the profit target measure the length of the head as you see it on the chart then project the line upward to gain the standard measured target. In this case it's about 4.12. Remember that targets can be exceeded, not at all or within reach.
For now be expecting the next drop keeping in mind a rally here and there and trading ranges.
As you can see price has pierced through levels 1-5 and is making its way through to price level six. I believe we will see lowest prices for BTC in April/May 2019. So keep steady those of you who are buying all the way down and to those who are waiting on the sidelines for lowest prices. Let's see where price will be April/May. The lower price goes, the better...
Look at the levels marked out on the chart. Like stair steps. If your belief is declining prices, then you will watch each stair step being taken out. In the short scenario each level will collapse accordingly as it is doing so now. Watch as you witness what might appear to be the failing of a crypto asset but in truth a market offering up the greatest buying...
Can you entertain the idea of BTC falling to single numbers? If so, then know, this will be the greatest buying opportunity.
Whether price fills the gap below today's price action first or not, watch for these price targets during pullbacks and rallies. Keep in mind price climbed higher on less volume.
Price has barely tipped into supply and it appears that early sellers are dominating the run from current price.
Prices have barely tipped into supply and it appears that sellers are dominating the run early.
There is time to follow the trend or patterns and indicators or a combination thereof. Each trade is specific to that and then there are those traders who do not use any of those things. Happy trading.
When you enter a market and price begins to move in the opposite direction of your position, you at times and at your discretion will make the choice to ride the market through. That means you must have enough in your account balance to ride the highs or the lows depending on your trade position. As you can see here, my entry on May 2/18 was a short position...
Prices have fallen deep out of the demand zone. Begin to look for a temporary bottoming effect even though price might drop a bit farther, but do begin to look for this bottoming effect because keep in mind you have this supply level that price has yet to acknowledge. Price always acknowledges supply and demand levels at some point, it's just a question of whether...


