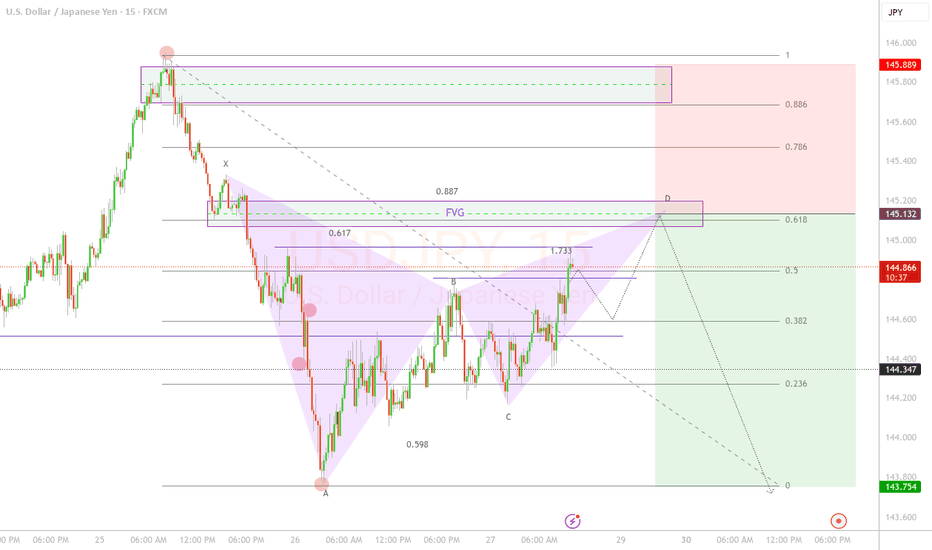
📊 Trade Overview Pair: USD/JPY Pattern: Bearish Gartley Timeframe: 15 minutes Direction: SHORT Setup Type: Harmonic Pattern Completion + FVG Confluence 🎯 Market Analysis The price is evidently bearish according to market structure, currently in a retracement phase, and I expect a bearish continuation at the 61.8 Fibonacci level of the wave. The harmonic pattern...
Bearish from the current price to 0.618 of fibo retracement.
Bullish candlestick pattern after breaking strong support. We are trading a divergence on macd and it broke the fibonacci level at 23.6.
trend line indicates bullish movement combined with demand zone and candlestick patterns.
Bat pattern with divergence and level 23.6 broken. Also currently over a demand zone and a bullish power candle.
GBPCHF showing a bullish formation over the support zone and the trendline.
CHFJPY divergence over support + pinbar.
AUDJPY showing a SHS inverted and indicator divergence to bullish entries, risk:reward 1:2
Resistence zone, 61.8% of the wave and false brekout of the channel. Divergence in OSMA, RSI overbought. Trade under your own risk.
• Divergence h1 and h4 • 1.272 Fibonacci Extension • OverSold
• Resistance zone • OverBought • Cypher pattern • Divergence
= Gartley pattern = Ascendant triangle = Inside Bar Setup will be updated.
The price is leaving the channel in a clean break. We are waiting for the best zone to go long.
1. UPtrend 2. AB=CD possible formation 3. Gartley pattern. FX:CADJPY
the price is coming back to the channel, it could hit the 50% retracement of fibo or 61.8%. Price action must confirm the rejection.
Iré en corto cuando se complete la "leg" D hasta el nivel 0.618 de XA ADVERTENCIA: Esta idea de trading es mi punto de vista sobre el par CADJPY. No corresponde a una sugerencia de inversión. Opere bajo su propio riesgo.


