olivernash
The initial GME wave of frenzy. Even 'market manipulation' is still just buying and selling, but with a bit more emotion involved. This is just one way of interpreting what happened.
Pattern recognition gone mad, or Federation conspiracy? Time travel will tell...
As per idea from last week, BTC is still following a correction pattern similar to that of the Shanghai composite index three years ago. This update remains the same as the original idea with only a slight alteration of the price oscillation curves. Full idea in linked chart below.
The EURUSD chart has reached the moment of truth. If the price consistently breaks this current resistance, we may be looking at a repeat of history and a 25% rise over the next twelve months. Anything could happen - the resistance could even push the price back down for another wave - but if you are currently holding dollars, watch this chart carefully over the...
What next for Bitcoin (and other cryptocurrencies that were caught in the recent fall)? As Ray Dalio says, "Almost everything is just another one of those " Here is the chart for SHCOMP (thank you tntsunrise): It covers a similar 'parabolic' rise to that of Bitcoin in 2017, and shows how the market stabilized after its correction. It is perhaps an indication...
What next for Bitcoin (and other cryptocurrencies that were caught in the recent fall)? As Ray Dalio says, "Almost everything is just another one of those " Here is the chart for SHCOMP (thank you tntsunrise): It covers a similar 'parabolic' rise to that of Bitcoin in 2017, and shows how the market stabilized after its correction. It is perhaps an indication...
Breaking this most recent consolidation pattern may be the strongest sign yet the fall is slowing to a stop, but can it hold? Watching to see if the trend change forms any further - just slightly different - consolidation patterns. Unless the bears show exhaustion on the current MACD cycle of the 5 minute chart. I may jump from the current rise and wait for the next...
To clarify an earlier post, I thought I would explain the signs that told me to sell my coins just before the beginning of the recent fall, in the hopes that it might help someone at some point in the future if they see something similar. It also helps me to write my thoughts down. A dramatic price rise can be seen on the chart as the popularity of...
2017 brought incredible popularity to cryptocurrencies and the market now contains a lot more people prone to 'fear of missing out' and panic selling. As a result the chances of a currency finding price stability at the end of a consolidation are slim, so as price amplitude gets narrow it tends to drop (or shoot up) and enter yet another consolidation pattern. In...
Yet another consolidation pattern? If it unfolds as such, I think I'll ride the rises once again. Where is the bottom of this fall in cryptocurrency land?
The next hour will be a telling time...
Is the MACD on the edge of a brief turn up, with the price bouncing slightly off the (potential) support, or is the 'support' going to cave early? I say 'support' because it is in no way established, merely assumed based on an estimated triangular consolidation pattern.
Riding some of the ups, but still watching to see if BTC (and BCH and LTC) are going to fill another downward consolidation pattern. If the price rises above 11650 I might start considering the fall broken, but time for bed here, no through the night trading for me :) Good luck to you all.
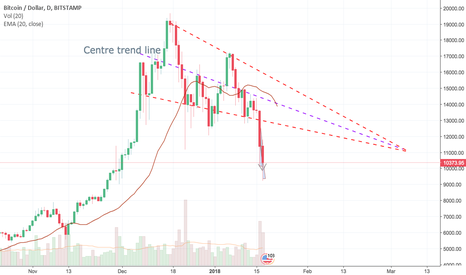
May be wise to be wary of going long just yet. At least three major coins look like they are consolidating in similar ways. They displayed this pattern in the month running up to the fall that began earlier today, just over a longer timeframe (see my linked charts from earlier); they may be readying to fall further on a smaller scale. I'm still not sure the...
New levels of support and resistance forming with each failed attempt by the bulls to raise the price. Seems to be leading to short-term consolidation and another potential breakout. Pointing to a further downward break? But then, the bulls are trying really hard and you never can tell these days, so maybe in the next hour they will succeed. I'm still watching...
In the BCH chart above, there are repeated attacks penetrating the support zone during a period of consolidation, then close to the end of the triangle, a spring upward, followed by a strong, shallow, sustained downthrust which broke the support. Similar consolidation and breakout has been happening in other major cryptocurrencies (see my linked charts). 2017...
Here is the larger scale potential coiling of LTC mentioned in an earlier idea. Though waiting to be tested again, the support seems strong. With all the excitement and popularity these days, crypto-coins don't seem able to maintain stability for long. So, it looks quite likely LTC will breakout sometime before the 20th January as its price amplitude gets too...
BCH has been in a farily steady fall for a couple of days, so perhaps more of a test for the support than previous drops. With current volume levels, I would expect the price to creep along on the support until some bulls or bears arrive, but which will it be? I'm watching... There is not much volume to carry the price higher, and not much to pull it down either,...


