otis_bagshots
This is my attempt at applying Wyckoff's methodology to the BTC/USD price chart. Wyckoff posits that, although price movement may appear random, it actually follows a repeating cycle that can be divided into four distinct phases: accumulation, mark-up, distribution, and decline. Based on historical data, it appears as though BTC is in the early-to-mid mark-up...
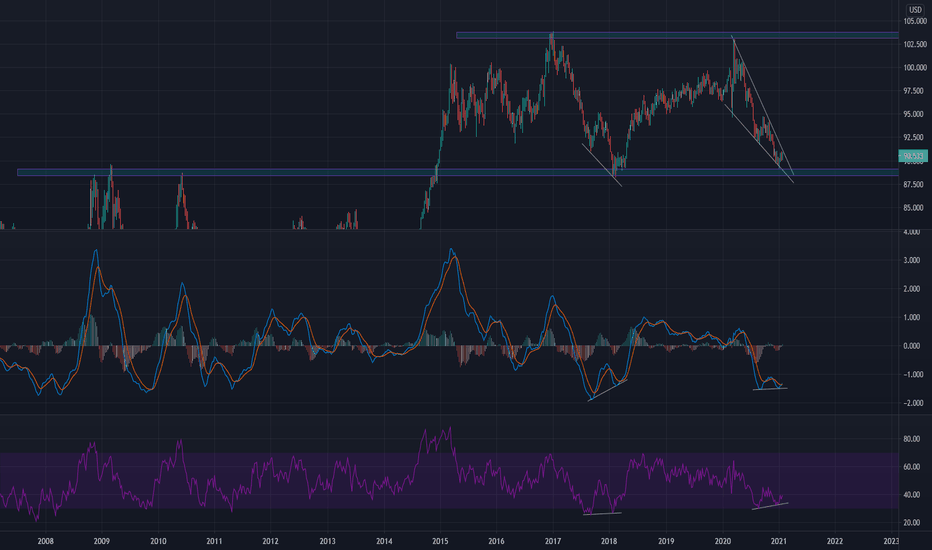
The US Dollar Currency Index (DXY) is trading near the bottom of a falling wedge. A breakout to the upside is probable given that: - Bottom of wedge coincides with a major price structure (horizontal support / resistance). - Bullish divergence on MACD and RSI. If a breakout does occur, expect a downturn in the stock market (DXY is inversely proportional to the SPX).
This is just speculation. Trading near support within pennant. RSI hidden divergence.
A volatility breakout could drive the price above the $20k ceiling of resistance. MACD is also about to cross the signal line.
Link is trading near a support zone in a falling wedge nested within a ascending parallel channel. This zone corresponds with support from the volume profile and the 0.382 fib retracement level. It is also exhibiting RSI divergence and is oversold on the Stochastic RSI. If it finds support, we can expect it to maintain its uptrend within the parallel channel.
Given that the DXY is moving inversely to the SPX, I anticipate the market to pullback if the US dollar strengthens.
The SPX, DJI, and IXIC indices have been forming consolidation patterns after the market-wide rally in early November. Each chart is displaying bullish hidden divergence and an oversold stochastic RSI on the 4h. Expect more upside until the upper lines of resistance are met, at which point the indices will either reverse or resolve upwards.
BTC is forming a bullish pennant nested in a parallel channel on the log chart. Next price target is ~$21k.
Square might be due for a pullback to ~$170 (0.236 Fibbonacci level & channel support line). - An extended bearish RSI divergence forming on day chart. - Trading near top line of resistance and above upper Bollinger band (2 standard deviations from 20 moving average).
XIU has formed a head & shoulders pattern over the month of October. Today it broke below the neckline, signalling bearish price action. It is also trading below its 50, 100, and 200 emas on the 1h chart and the MACD is below the signal line. Next test of support is the high volume node centered around 24.4 (-0.81% downside).
- CRM appears ready to break upwards out of a Bollinger Band squeeze . The same bullish price action occurred when it reported Q2 earnings in late August. - The Commodity Channel Index , a measure of the current price level relative to the 20-day average price level, has moved above +200. This indicating a strong uptrend is beginning. - A bullish MACD crossover...
BABA is consolidating in a falling wedge within a larger uptrend. It will experience upside price volatility if it can resolve upwards. There also appears to be bullish accumulation / distribution divergence forming over the past week. This cummulative indiactor indicates how supply and demand factors are influencing price. In this particular case there may be...
PYPL appears to have resolved downwards out of a falling wedge. This suggests it has more room to fall before finding a bottom. Next level of potential support is the 100 sma.


