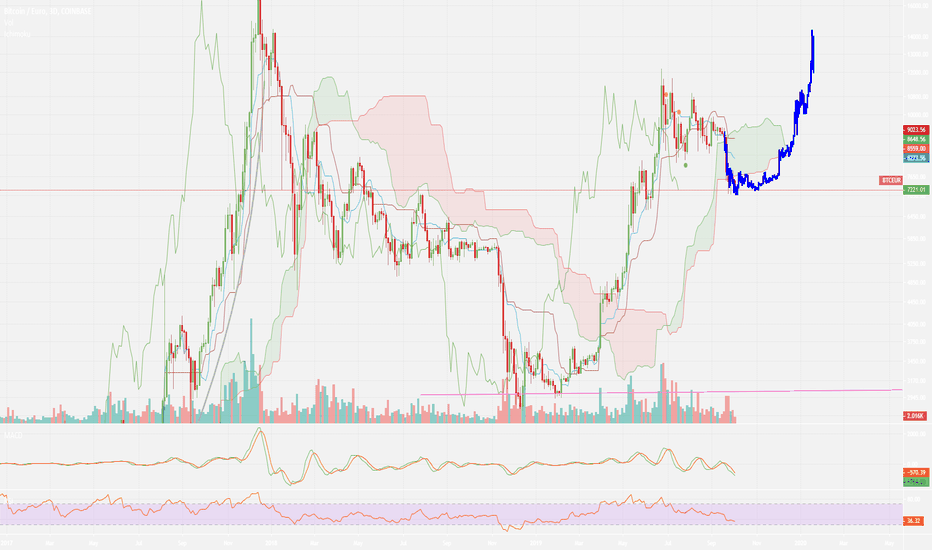
MACD and RSI indicate a possible good entry point for a long entry. TP1 @7000 Target is @7500 on the main resistance of the descending channel.
XLMBTC is probaably doing a cup and handle pattern. Max target is 820 satoshis Handle range is 710 - 730 satoshis Watch for a breakout @730 to enter in a long position/buy entry Happy trading !
This looks like a textbook bullflag for BTC and the step 4 of an 1-2-3-4-5 elliot wave pattern. Watch carefully for a breakout at 8450e for entering a long position. Final target is 9450e. Happy trading !
BTC on 4h frame made a nice breakout in a bullish flag formation. MACD also crossed the signal line in on 4h and daily frame. Expected maximum target is 7670 euros.
BTC will continue is bullish momentum for the next day before making another higher low. sell @7700-7800 rebuy @7400-7300
As mentionned in my previous post, BTC follow a pattern and tend to repeat history. BTC will retest 7000e before entering in an accumulation and a new parabolic rush as seen in the last ATH of 2017.
BTCEUR seems to have break the bearish trend for the moment and is in a small accumulation bullish trend. Some nice moves could be : sell @9400 buy @9050 We should have an important change near 6sept at the end of the blue triangle to determine if we could retest the 10000 resistance or falling to the 8000 support.
The more I look, the more I think we are repeating history on a shorter time frame and in a smaller scale price. I am convinced that we have some difficult periods ahead before another bullish market. This is not a trade advise.
It's seem that BTC is doing a nice cup and handle pattern, and have break out as expected from the pattern. Target is 10700. tp1 : 10300 tp2: 10400 tp3: 10550 stop loss: 9900
As you can see, BTC follow exactly the same line as the previous ATH except for the "big news" about Bakkt and provide a small pump. Will BTC repeat the past ? There is a lot of chance.
After the 5th wave, we have a ABC correction and BTC is forming a big descending triangle ready to blow at anytime, but not now. We have to reach the bottom first. A 30% correction is nothing compared to a 300% bull run, patience is the key. Buy at 7800-8300€ or 8600-9200$
The last inverted H&S provide us a nice trade swing, but we not enough momentum to break the resistance. BTC is now in a bearish descending channel for sure for at least one week. Target is 8800.
As expected in my previous idea, we have reach the neckline of this inverted H&S on the head and it's ready for his right shoulder . Watch out for the next 2 candle to confirm the trend and set your positions accordly. If you short, next target is 8950-8700, otherwise wait for closed candle above 9600.
I think BTC is in a descending channel symbolized by these two yellow line. It will certainly bounce on the 8ke support and reverse on a nice inverted H&S with 10k as the neckline.
This looks like we have a nice H&S pattern here. I expect the price to drop to the height of the head to 8400euros.
COINBASE:BTCEUR is forming a Symmetrical triangle. We have to choice here : a bullish or a bearish scenario. I'm betting on a bullish scenario with a target betwen 10800 and 11300 (+7%) depending on the breakout price. Just wait 3 more candle to confirm the trend.
I think we have a nice inverted H&S with a possible breakout @10500. Buy at 9800 and watch at 10400 for a possible breakout.


