paper_Trader1775
PlusGood day please see chart for key level and visual representation of the flag 📌 Hypothetical Strategy ✅ Momentum Entry (Bullish Breakout of Flag): Condition :Detail Trigger :Close above $30.50 with bullish candle and volume and clears possible flip zone Stop Below $29.50 Target 1 $31.50 Target 2 $32.27 (key resistance) ✅ Value Entry (Pullback to 200 EMA /...
🎯Hypothetical Strategy Direction Entry Type ✅ Short Value, Entry Trigger: If price retests $8.50 & rejects again Above $8.60 Stop Target $8.20 → $8.00 or if price breaks below the 50 EMA ✅ Long Momentum, Entry Trigger If price closes above $8.58 (200 EMA) with bullish candle Below $8.45 Stop Target$8.93 → $9.20 🔔 Right now, the chart leans bearish bias under 200...
Optimal Trading Strategies Based on Key Levels ✅ Bullish Scenario: If Price Holds Above $0.30 Entry: Above $0.31 (Confirmed breakout). Stop-Loss: Below $0.27 (Invalidation). Target 1: $0.40 (Key resistance). Target 2: $0.51 (ChoCh & major trend reversal point). Risk-to-Reward (R/R): 3:1 or better. ✅ Best Confluence: If price retests $0.30 as support after...
📌Ascending Channel ✅ Bullish Strategy (If Price Holds Above $9.60 Support & 50 EMA) Entry: Near $9.60-$9.71 (Confirmed support hold). Stop-Loss: Below $9.30 (Invalidation of support). Target 1: $11.22 (ChoCh Level). Target 2: $12.34 (Major resistance & key level). Risk-to-Reward Ratio (R/R): 3:1 or better. ❌ Bearish Strategy (If Price Breaks Below $9.60 EMA &...
✅ Bullish Case (If Price Holds Above ChoCh - $12.39) Entry: Above $12.50 (Confirmation of 50 EMA break). Stop-Loss: Below $12.30 (Invalidation of ChoCh). Target 1: $13.07 (Key Resistance). Target 2: $13.46 (Major Resistance). ❌ Bearish Case (If Price Falls Below ChoCh - $12.39) Entry: Below $12.30 (Confirmation of failure). Stop-Loss: Above $12.50...
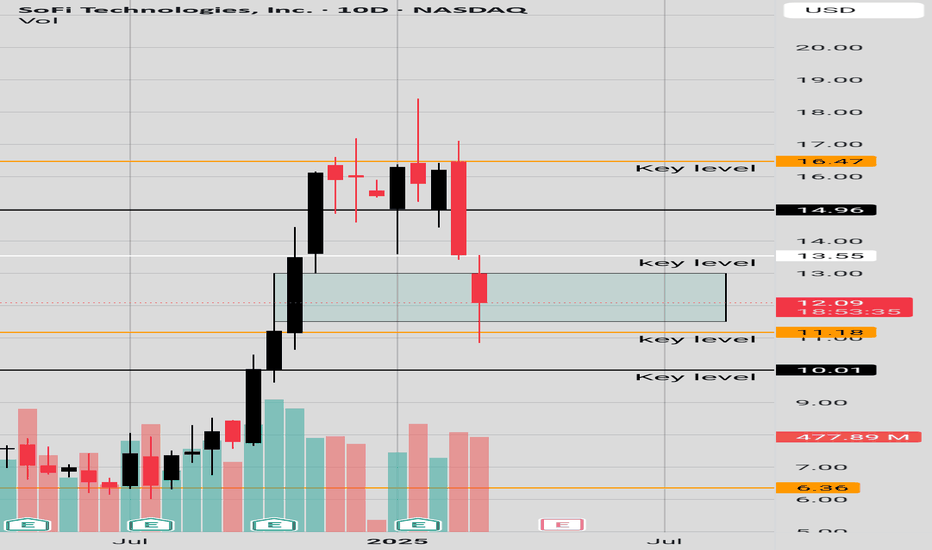
On the 10Day Chart price had a serious correction, investors want to know is it over. RSI is kind of bearish/neutral. Stochastic RSI says there is more room for price to decline. However, we have a high wave candle in a bullish FVG zone with price rejection around the 11.00 price range. On the 10Day Chart we are going to need price to clear 13.55 price for more...
Good day team, good job RGTI holders this past Friday, but please be careful because in a few days if price follows this downward parallel channel, price may decline and if it does breakout the parallel channel it has to overcome the 13.07 price range for good long term bullish action. Please look at 10 Day chart for key levels.
There is a downward descending channel with a potential double bottom forming inside if we can get a breakout of the channel and of the resistance we might have some bullish activity hopefully to the 50 EMA; however, the current sentiment on the chart is bearish and if we have bearish break out bears are in control. Please see chart for more clarity.
Please observe the wedgelike structure for SOFI, we had a little boost on Friday but not enough to close out the wedge like structure, price needs to overcome 12.50 and make a higher low or retest 12.50 for a safe long entry, if price falls back below the low of the wick candle and inside the wedgelike structure the shorting may continue, please observe the chart...
Here we have SMCI on the hourly chart, we recently just had a bearish cross over with the 200 SMA crossing over the 50 SMA. Price was consolidating and then broke out of the downward parallel channel but if price does not overcome the 39.16 price, we might see some lower prices for SMCI. Please see chart for key levels
good day team, please see how that value zone resistance crept back into the picture, we need a clean break from that resistance and possibly a retest, please be careful, please observe the falling wedge we are breaking free from, also notice how the 50 EMA is serving as a resistance
For MATIC to get back in the game it must break and retest the 0.3010 price area, The oscillators are looking healthy let's hope we continue to get some good price action!
SOFI is appearing to form a double bottom; will it be enough to push through 14.80 and get a little mini pump or is price sadly going to fall through 13.60 and have a little dump?
Strangely XLM is still above 200 EMA, and it made a bullish hammer on the 200 EMA, if today's candle closes above the hammer candle, that may be a sign of some positive price action, also if we can get an upward break of the 10 EMA and the trendline that would be great confluences. Please see chart for details.
Good day Team: With time we can tell. SOFI is consolidating after an intense correction at a key level 14.65; at times past that level served as a reversal after prior consolidation, but we need a lot of buying pressure to reverse that downtrend. Have a good day please stay safe.
SERV is in a special rectangle after price action hit a key level and now it is consolidating, please watch for movement outside of the structure please look at chart for key levels. Break out may be significant in either direction. Please be careful
Here we have this asset at a critical point in the parallel structure, time will reveal if it falls out the channel to the Demand Zone or cycle up. Please see chart for key levels and parallel structure. Price must overcome the 11.83 to avoid the descent to a possible down trend.
Long Wick Candle in the golden zone of a Fibonacci level. Is the double top correction over. Let's keep and eye out for price action around the hammer candle and watch out for fake outs and be mindful of corrections and other time frames.


