The graph shows a symmetrical triangle pattern with a downward trend, where the break point is detailed and the touch points are indicated with arrows.
The graph shows a trend channel with an upward trend, where the touch points are indicated with arrows,
In the graph a bullish falling wedge is observed, where the upward break point is shown. The touch points are also indicated with arrows.
A symmetrical triangle pattern is shown in the graph, where the break point is pointed upwards and the touch points are shown with arrows.
An Bullish falling wedge pattern is shown on the graph, where the break point is shown and the touch points are indicated with arrows.
The graph shows an ascending triangle pattern, where the breaking point is indicated. The touch points are also indicated with arrows.
The graph shows an uptrend line, with arrows pointing to the touch points.
The graph shows different lines of support and resistance lines, indicating the touch points with arrows.
When prices cross the Moving Average upwards it is a sign of purchase and conversely, prices cross the line of the mobile average downwards, it is a sign of sale.
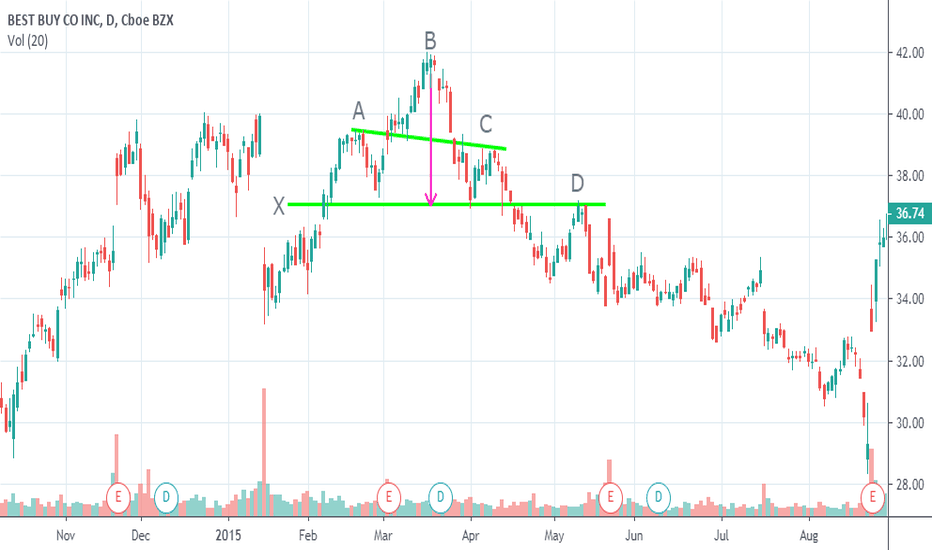
The graph shows a double cap for Best Buy CO INC shares, showing that peaks A and C have similar heights. You can also see the breaking of the support line and immediately the Pull Back
The graph shows an example of the head and shoulders for actions of Citigroup INC, where the shoulders (peak A and C) are of similar height, with peak B (head) being the highest. The distance between the head peak and the support line "X" and the Pull back at point D is shown with the purple arrow O35.26, H35.70, L35.06 C35.40
The graph shows a downtrend line with multiple touch points, marked with flags, in Apple shares
The graph shows a downtrend line with three touch points in Apple shares


