Spot Signal for Weekly Cycle, STPTUSDT These are spot signals suitable for the 2025 investment strategy. I use a multi-timeframe trend analysis system combined with a structure-based system. The monthly timeframe is currently in an uptrend, and as of now, the monthly trend (M) is still ongoing. In May, June, or July, the monthly trend of STPT is expected to...
BUY XRP - SWING TRADE TO $6+ - OPPORTUNITY TO ACCUMULATE THIS POTENTIAL TOKEN IN 2025 TRADING STRATEGY Type: SPOT (No Leverage) Using SPOT trading will help you avoid liquidation risks and comfortably hold through market volatility for extended periods. Holding Period: SWING Planning to hold XRP for 3-6 months to capitalize on the long-term uptrend,...
BUY CHRUSDT, SWING BUY 2025 Entry: Around the current price, the lower the better Close Buy: Around 0.3 Swing Buy: 2025
Do you want BTC to drop on April 27 or May 11? If it drops on April 27, BTC will decline sharply. If it drops on May 11, BTC will only correct on the D1 timeframe and then continue rising on the weekly timeframe. Which option do you choose?
D1 still hasn’t formed a peak? Long this week, the peak is still on D1. D1 hasn’t signaled a top yet, and the smaller H1 or H4 timeframes are correcting to continue the LONG upward move.
BINANCE DELISTING IS THERE STILL HOPE FOR THESE COINS? Binance has delisted the trading pairs for STMX, NULS, BAL, and FIRO. So, is there still a chance for these tokens? Currently, these pairs still have liquidity on a few other exchanges. Now, let’s dive back into the charts to see if there’s anything worth exploring. Overall, the Weekly (W) and Monthly (M)...
The discrepancy between mapping and the real-time market is almost zero. This is pure luck, nothing else. What is Mapping? Mapping is a method of projecting outcomes based on reading current and historical real-time data. To achieve accurate mapping results, you need a system that correctly identifies trends, accurately detects peaks and troughs, and clearly...
BTC D1 has not yet reached its peak. Currently, the Long peak for BTC is on the D1 timeframe, and D1 continues to confirm upward movement each day. Probing for the D1 peak has not yet confirmed a top.
I want to share with you a mindset about why, as a trader, you often face trouble when the market hasn’t yet shown a clear Swing Buy or Swing Sell signal. When the market is in a good state, meaning it’s showing a clear Uptrend or Downtrend, you’re almost guaranteed to make a profit. However, during such times, your only issue is taking profits too early,...
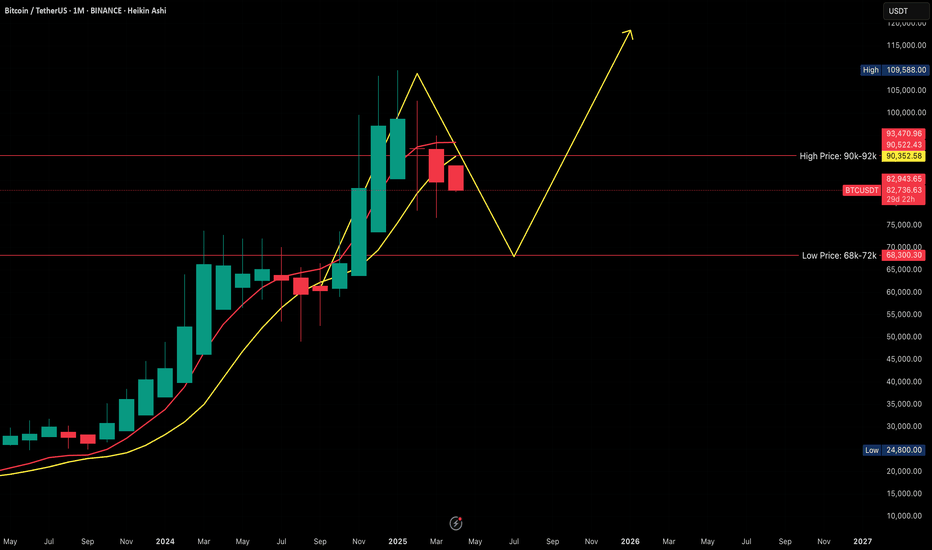
Shift the bottom from 68k in the previous mappings to the 55k zone. Up to this point, there’s still no Swing Buy signal from the market, folks. Shift the bottom from 68k in the previous mappings to the 55k zone. If it happens fast, we’ll see another price drop tomorrow. Shift the bottom from 68k in the previous mappings to the 55k zone. If it’s quick, we’ll get...
DXY & BTC FOR NIGHT OWLS You know, last Friday night I posted that DXY would see a corrective upward move toward the 104–105.3 range—just a corrective rise, mind you. At this moment, there’s a bit of a conflict between DXY and BTC. DXY wants to edge up slightly to that range after bottoming out around 101.7. Meanwhile, BTC is stuck, unable to rise alongside...
Market Analysis: BTC Weekly and Daily Outlook Since BTC has closed its weekly (W) candle—let’s call it a tentative success—we’ll follow up with a view to reflect the market’s intent for the upcoming week. Here’s the breakdown: ------------------------------------------------------------- Weekly Candle Perspective Why isn’t BTC continuing to rise and instead...
TOTAL will soon decrease to the range of 1,670 billion USD to 1,900 billion USD? Note: The response version of the AI Agent To estimate the price of Bitcoin (BTC) when TOTAL drops to 1,900 billion USD and BTC.D (Bitcoin Dominance) is at 65%, follow these steps: Step 1: Calculate Bitcoin's Market Cap TOTAL (total crypto market cap) = 1,900 billion USD. ...
IS THE "GOLDEN HOUR" FOR A 20% BTC SHORT DROP APPROACHING? Hello everyone, Yesterday, I provided you all with a detailed and comprehensive analysis of the events BTC will experience in April. After the March candle closed and the April candle opened, things have become quite clear and well-defined. However, in the "BTC April Analysis" post, the monthly candle...
BTC ANALYSIS FOR APRIL 2025 BTCUSDT chart: M, W, D1 cycle So, BTC has closed its March candle, ushering in an April candle full of intrigue but not surprises. This is because BTC has already confirmed its movements for the next 1-2 months, at least until June, before resuming its upward trend. This means BTC will continue to move sideways with a downward...
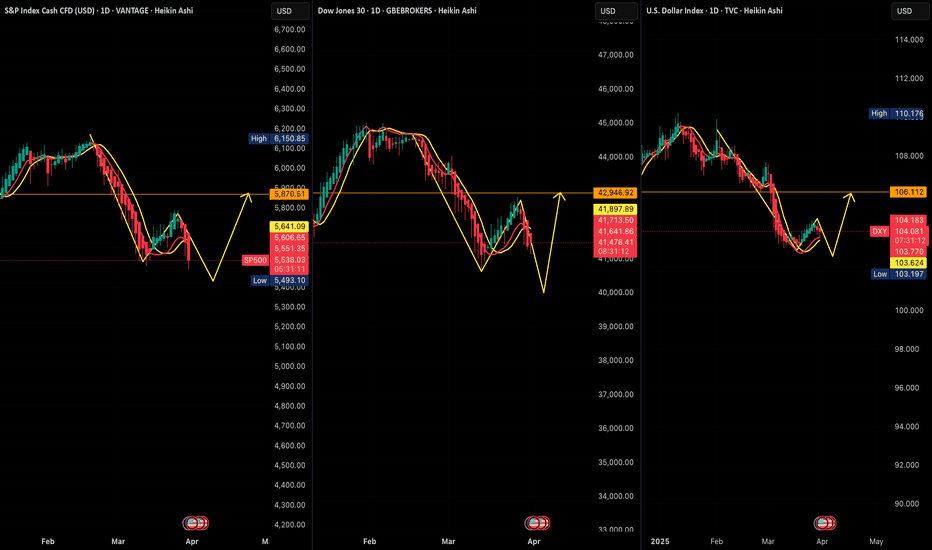
WHAT WILL HAPPEN NEXT IN THE U.S. ECONOMY It’s the Dollar Index (DXY) forming a bottom on the D1 timeframe and adjusting upward to the 106 zone. Naturally, U.S. stock markets will experience positive growth again. This is a signal for the rise of BTC and, conversely, a decline in gold prices. Gold will soon peak in this month of April, making way for the...
DEXEUSDT.SPOT.SIGNAL We have a Spot signal for DEXE: Entry: $15 - $17 Target: $28 - $32 Hold Time: Follow the new upward signal on the Weekly (W) timeframe Note: Currently, the Weekly (W) is forming a bottom, nearly completing the process—just a little more time needed to finalize it. Good luck!
ZROUSDT SPOT SIGNAL We have the following Spot signal: Entry: $2.2 - $2.3 Target: Above $3 Hold Time: Follow the D1 cycle (new upward slope) Note: Currently, D1 is in a downward correction; wait for the signal to buy. Good luck!


