reees
take a look at what happened when BTC price approached the long term trendline in june of 2017 prior to the epic bull run.
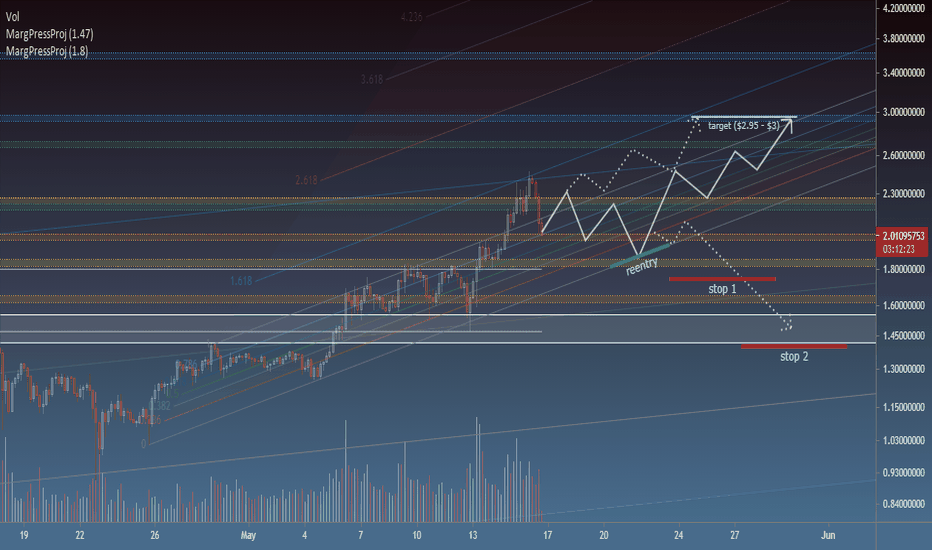
tldr; i think price is headed to $3, but not before some more retracement we nailed the last target , but where ADA goes from here is not so simple. i think the most likely scenario (solid white) is a retracement somewhere between $1.80 - $2.00 at the bottom of the minor channel before making its way back up to the recent ATH, and eventually up to $3.00 in...
what does price do after crossing above this major trendline? it goes batshit crazy, that's what it does. i'll see you on the other side.
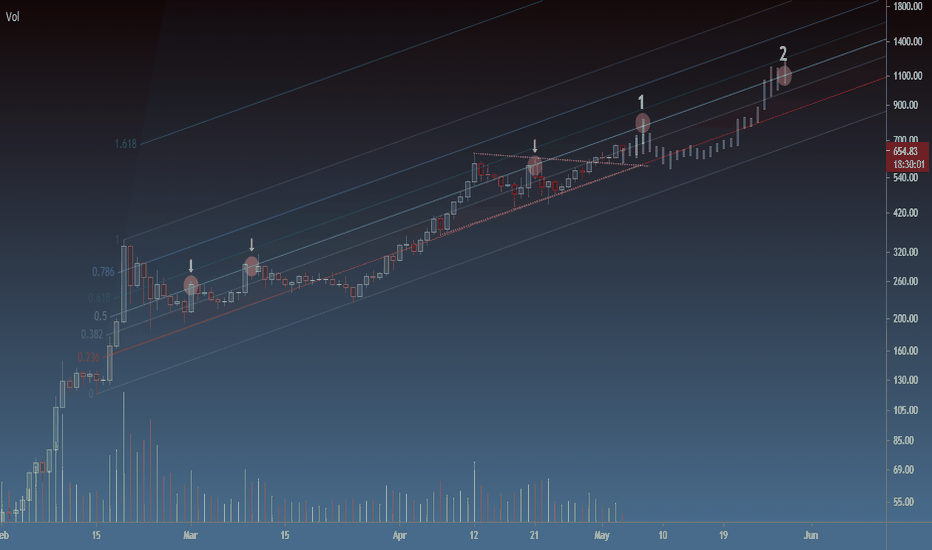
price is running into the bottom of the channel, so it looks like time to head back up for a new ATH . the pink dotted lines are where i expect resistance along the way, so i'll be looking to take profit at each of these levels. the recent low ($526) at the bottom of the channel should provide confidence as support for margin traders, which is why i like the $1050 target.
the chart says it all. the simpler a chart is, the more confidence i have in it. long term trendline is strong (<2015). i consider $11k by 8/30 quite realistic/probable. there are certainly more bullish scenarios (i won't get into those because the crypto space already has enough of that to make you sick). the more bearish scenario would stick along the...
continuing to look at margin buying pressure to project resistance zones. looks like we may see some resistance around $4700 and again at $5200. if $5200 intersects with the 1.618 extension of the channel, i'm thinking that's where it may retrace a bit and consolidate.
if predicting the top was easy, we'd all be really REALLY rich . like most things in life, i don't believe there's a magical formula or algorithm to make such a projection. but using all the information available to us will certainly help get us closer (and close is usually good enough to make a ton of money!). in the case of BTC, i think there's a lot of...
LINK is moving on up again. i'm aiming for $53.5 at the top of the channel to take some profit. i would expect a bit of retracement after that, but you never know. this is looking like a clear breakout so i'll be holding on to at least half of my LINK bag in case price clears the channel entirely. let me know if you see things differently....
i'm eyeing $3900 for the next ETH/USD target. i'm expecting resistance here due to a drop in buying pressure from leveraged traders. right around this level you can see 5x, 3x, and 2x leverage losing key support below their liquidation levels. i've learned that the margin trading degenerates have a great deal of influence on the market (this makes sense since...
crossroads approaching for VET. the trendline, .786 fib (which has been a support/resistance level), and top of the triangle are about to converge, so it's safe to say VET will be making a move soon. no idea which way it will go. my stop is below the trendline. if price breaks below it, i think it's headed for the middle of the channel. if price breaks out...
ADA is running out of room to range between the channel and the ATH resistance at $1.60. i think she's getting ready to break out. if/when it does, i'm targeting the 1.618 extension of the fib channel (price has stuck to this channel like glue for the last year or so). that would put us at $2.25, at least. note that this is a linear target (not fixed) and may vary...
VTHO looks to be approaching a key area. i'm watching for a bounce off the bottom of the channel. i think a bounce would confirm the channel, and if this channel is valid... we're in for a treat. Target : 1st target seems pretty obvious to me ($0.027). after that i think we need to set additional targets as we go, depending on timing and how the fib extension...
i'm seeing the .5 level acting as intermediate resistance within the channel. you can see it's been tested a few times over the last month. to me it seems like a good bet for taking profit in the near term. there may even be another opportunity to buy towards the bottom of the channel, but i'd be leery of bears if price heads too far in that direction (check...
for a month or so now, i've suspected ETH was forming a new bullish channel. top of the channel has yet to be tested/confirmed, but is fast approaching. normally that would be a level where i take profit ($3400-$3500 range), but i'm so bullish on ETH i wouldn't be surprised to see an advance straight up towards the 1.618 extension. if the channel is confirmed...
oh you sweet sweet recursive data set. here i see a major "bump & run" (which is basically just a head & shoulders for assholes). in a vacuum, probability says this is bearish . luckily we're not in a vacuum, we're in a bull market! and this major bump and run has two little INVERSE "bump & run" babies! gonna be a good week.
ever wonder why BTC seems to go for a run after the last friday of every month? it's the BTC options expiry! coincidence? i think not! watch as price approaches the prior trendline. i'm betting price flips resistance back to support before the bull train rolls along to a new ATH. i'm not 100% long until that support is established (or a convincing advance to a...
this is a really interesting one to watch, and perhaps the most consequential for the long term crypto investor (BTC and ETH make up about 50% of my investment account). will there be a "flippening" this cycle? doubtful. but you can bet for damn sure i'll be holding more ETH than BTC for the foreseeable future. interested to hear what others think about this narrative.


