remarkableCake99061
Gold has been going crazy since December of 2024. Bulls have pulled price up from 2,600 up to 3,200 current at all time highs. Typically in trading we use major support and resistance zones to confirm trading targets & zones. Charting into new territory of all new all time highs can often be very difficult to do because there are no resistance zones to target when...
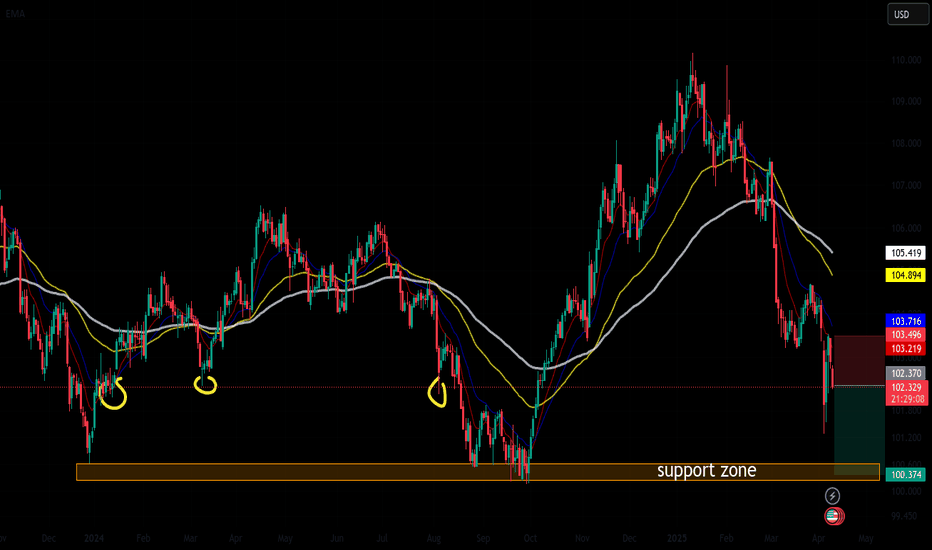
The dollar is crumbling to dust fast. The latest tariff news with China is going to spiral the already bearish market into a future spiral. The earning moving average values (red 5, blue 10, yellow 50, white 100) are all below price action currently. On almost all of the time frames. We are currently sitting at a very minor support zone as circled in yellow....
By now it's fairly obvious we've entered a bearish market. From a peak of 109k to now 82k this is hard to argue. We can view our earning moving average data with the red(10day), blue(20day), and yellow(50day) to see the candles are well below all levels. The most important level on the bearish confirmation is the 50 day EMA cross. This is known as a 'death cross'....
The S&P 500 is pointing at a long descent downwards based upon simple technical analysis. To further bolster our projection of the market it is no secret the recent trade wars are going to have a major negative impact upon the US & world economy for obvious reasons. With this in mind we can paint a clear picture of where price action is going to head. The...
Great news everybody! We have finally crossed the 50EMA over the 100 day EMA. 100 day EMA is shown as white, 50 as yellow, 10 as blue and 5 as red. So what dose this mean? The EMA values are the earning moving averages calculated here shown on the weekly time frame. A far view out on the weekly chart will give us a longer term on the trend of the future market...
Doge a random meme coin that has placed itself in a top 10 coin with nearly 9 billion invested. The power of memes and Elon have shown so many times in the past, as those circled in the chart, that this random coin ramps up from this area of support for 25-50 percent returns. This has occurred so many times randomly throughout the past 2 years. Looking at overall...
50 EMA death cross forming on the 4H on bitcoin. This typically follows in a sharp decline in price at least down to previous support levels. A massive decline in price today liquidated tons of entries on those that were bullish. 25.5K appears to be a critical level here. Price has broke two previous lower supports levels as pictured. We should except a slight...
As we can see price is declining below the 50 day moving average on the weekly chart as represented by the yellow line. What does this mean? Typically, this is called a 'death cross'. Price will decline as you can follow along previously how fast price fell from prior crossings. As of right now we are hovering right on the 50 and below the 100(white line). With...
wait for resistance to below trend line enter short for ~20 percent profit
In the past roughly 12 hours JOE has increased nearly 10 percent. We can see the formation of 3 tops of clear resistance for price. This quick jump in price indicates a FOMO pump from long buyers that typically ends in a pull back as those that bought in earlier dump onto those near the 3x peak seen previously. We have not seen price break our stop loss since...
Possible long entry approaching on sand for five percent profits. Wait for bounce off the lower support levels and hopefully the next wave will break the resistance to the next higher level of support. We are showing the 10D ema above the 20 EMA and quickly approaching a cross on the 50(yellow) on the daily and well above on the 4H. Watch our as the market as of...
Massive pumps always include massive dumps after price action failed re-test of previous highs down to previous support levels. Watch for 50EMA(yellow) death cross and enter short for ~20ish percent profits down to lower support level.
Bitcoin cash in the support zone currently for a break out. Watch out for support around 700+ dollars. We the 10 day ema is crossing over the 20 along with the 50 and the 100 is near too. Previous following trend line shows support for upwards to 1,000+ with a few pull backs along the way I'm sure. The long "W" formation is closing to breaking the retrace should...
Previous uptrend patterns showing upwards climb to previous all time highs of bitcoin should see 55k in the next few months easily if we can find support at 55k we should see even greater all time highs hopefully before end of the year
breakout upon usbreakout upon usbreakout upon usbreakout upon usbreakout upon usbreakout upon usbreakout upon usbreakout upon usbreakout upon usbreakout upon usbreakout upon usbreakout upon usbreakout upon usbreakout upon usbreakout upon usbreakout upon usbreakout upon usbreakout upon usbreakout upon usbreakout upon usbreakout upon usbreakout upon usbreakout upon...


