ricodrico
PlusThe 4-year-supportline of the Total Crypto market Cap is about to crash with all resistance lines and EMA's. Get ready for a huge move. This could be and ALT Coin season, or a total break out.
The Total Crypto Market Cap has reached it's more than 4 years bottom trend line (starting from august 2015) Breaking this key supportlevel would cause serious damage in cryptoland. But if we can stay on this trendline, it's the bottom to jump into crypto. What should you buy? BTC or undervalued serious ALT projects? The choice is yours...
If you look at the charts it's quite clear that the Total Market Crypto Cap has to choose between bulls and bears in two or max three weeks. The weekly EMA's and the trendlines (starting from 2015!) are collapsing with the downward trend lines.
The total Crypto Market Cap is bouncing again from the 0.5 Finobacci retracement level. This is typical in a early staged bull-run which has normal corrections like this one. If the Total Crypto Market Cap remains above 235 Billion dollar, things can go up rapidly. If not, the Crypto market cap could fall to the 0.618 FIB level, at around 200-205 billion
If Stellar Lumens (XLM) holds it's current price and could manage to break above the EMA's, it's the classical double bottom for XLM and a huge buy opportunity.
As seen in the chart, BTC's dominance is currently facing resistance and is likely to fall back to 62%, when supported by the EMA. This means a short alt revival is on the corner, maybe initiated by ETH or XRP.
The total marketcap is about to correct even more, as several indicators looking bearish for a further correction. The red line in the ADX and DI indicator is about to take over the green line, which usually means a significant drop. Also, the MACD is looking bearish for the short term. The RSI and stoch RSI are heading for lower points as well. Folowing this...
Check the chart below and don't panic now....take the time!!
It looks like the total market cap is for a bullish turn again, since it's now above the daily EMA's. If we keep support on the EMA's, things could go explode very rapid. If not, we will drop significally. So prepare for a huge breakout at the 3rd of august.
The total market cap of crypto assets has been rising from the 8th of february this year. We're now at a point where we can see if the bullphase will continue or not, since we're on the base support trendline. If the coming days are positive, the bullrun win continue with a strong upwards momentum. If not, we could see blood in the streets...
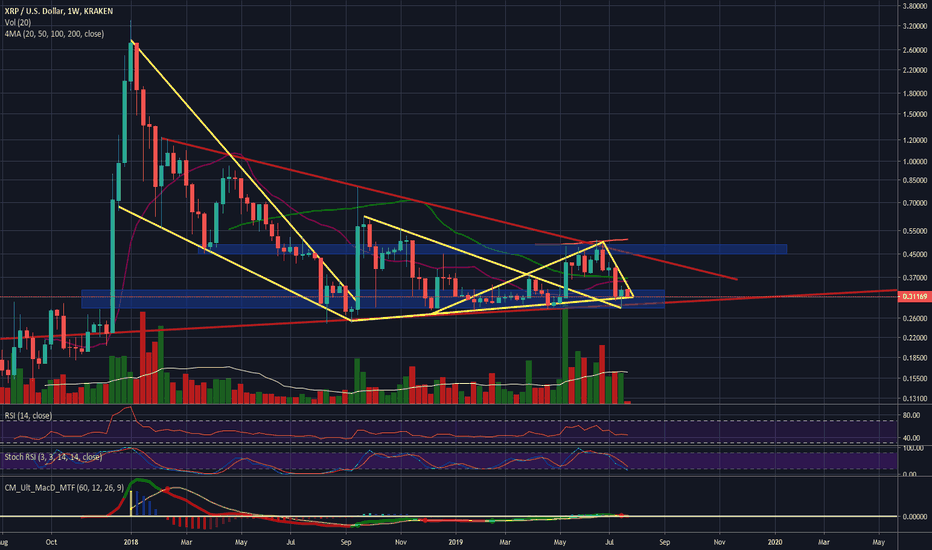
It looks that it's about to showtime with XRP. If you look at the XRPBTC chart you'll notice that XRP is highly undervaluated. If you look at the XRPUSD chart you'll notice that the price of XRP now is less than 2 years ago, before XRP even was live. Now is the time to buy if you believe in this digital asset and you follow the news.
As the BTC chart shows, Bitcoin did not test it's run up with the purple line of the 20 Weekly moving average. This is highly strange, if you compare the last bullrun in 2017. In fact, BTC never did this! If history repeats itself, BTC should be going down to approx. $7.500 before it goes up again. What do you think?
Leading indicator Litecoin (LTC) is showing the way for crypto's in 2019. Time to see what indicators say for it's next move. The weekly MACD looks starting a bearish movement, but it could still be a false signal yet. The RSI is still above 50% The ADX and DI don't show any particular movement, but the ADX shows some momentum. Following the bearish and bullish...
Since it's capitulation since december 2018 Litecoin doesn't look to slow down. Strangely enough LTC seems to lead the ALT Coin movement and shows us the way. If Litecoin remains above the weekly EMA then no worries folks!
Ethereum's ascending supportline, started mid december 2018, is still holding for ETH. However, to continue it's upward momentum, it needs to close on the weekly above $246 and find support above the weekly EMA's. If so, it looks a nice buy.... What do you think?
XRP/BTC is heading for a huge move. The downwards EMA and the ascending supportline will match perfectly in a couple of days. XRP has to choose if it breaks to the upside or not. Considered that BTC already moved upwards and XRP finds a years-support-line, i would think that XRP is heading for an upwards move. The daily MACD and the RSI seem to support that...
Is BTC's rollercoaster heading upwards? On the monthly logscale you should say that BTC faced resistance for 2 months in a row now. Looking at the EMA, BTC is trapped between the EMA and this trendline.
XRP is a typical asset that historically has proven that it has a long period of decline and then a sudden short moonly price increase. On the log scale, started from 2014, you'll notice a -89% drop and find support over a 833 day period, followed by two aggressive lifts with 5700% increase. Based on the same price and time movement, this will bring XRP towards a...


