rludvik
IF count until #3 is correct (BTC won't rally from here on), I would expect it to pullback somewhere around/between 7575 and 7750. This would be our #4. After I would be seeking for #5 somewhere in the middle of current uptrend channel. Why? 1. At 7570 there is .382 Fib level of the whole leg (from 6079 to 8506). 2. #3 is at 1.618 Fib level of the first impulse...
I canceled the last trade a little bit too soon. If I would step into, I'd reach target 1 at 118 (7% gain). But OK, let's try another one. There is uptrend channel forming on 4H chart and point of interest would be on intersection of bottom of this channel and the middle of the bigger downtrend channel (marked green). I'll wait for waters to clear up before set...
Entry between 168-174 with marked targets and initial stop loss at 150. Disclaimer: this idea is solely for my own purposes, to satisfy the ego, if it will work out ;)
If this would be triple top, this will be my small risky trade. Disclaimer: this idea is solely for my own purposes, to satisfy the ego, if it will work out ;)
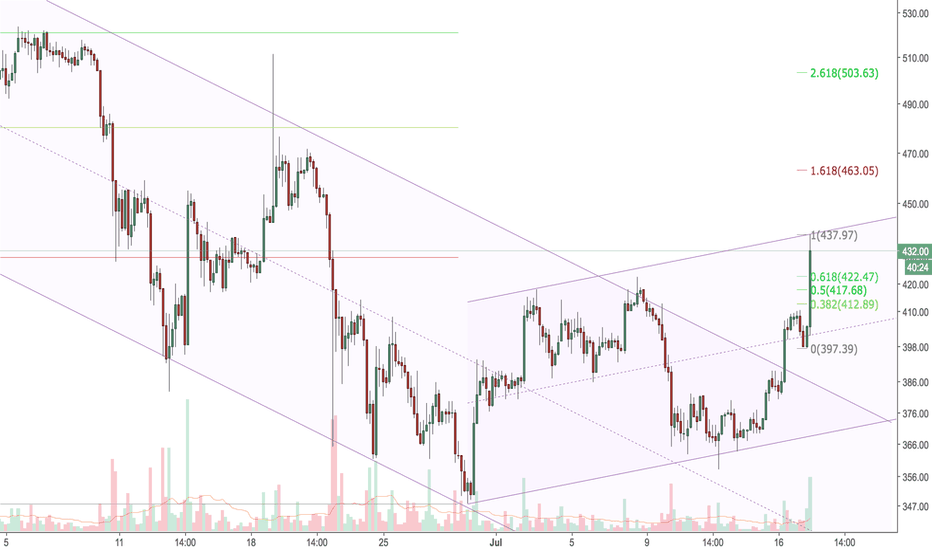
Levels from the last analysis (the linked one with canceled trade) were never reached, so time for new one. ETH touched the 0.618 Fib level of last drop and the middle of the uptrend channel. Pullback is expected to the bottom of the channel, somewhere around/between 382 and 385, with targets at 415 and 440. Initial stop loss will be set at 358 and will be moved...
Nice run, BTC broke the green resistance belt and hit the blue line - previous support (look at the 1D chart bellow for better sight). For sure there will be some trouble, but how much and how low will it pullback? I'll add portions at Fib significant levels on the way down, starting with the smallest portion at around 7170 and increasing it if it will go lower....
ETH can be trickier/riskier than BTC. It can also just hit 420 level and run again, but it can also drop all way down to the middle of channel somewhere over 400. More patience and lower timeframes will be used to see how it will behave. I'll post updates (regularly, hopefully :) Disclaimer: this idea is solely for my own purposes, to satisfy the ego, if it will...
Based on chart, it could be that break above 6620 would lead it to 6900. Disclaimer: this idea is solely for my own purposes, to satisfy the ego, if it will work out ;)
Tom wrote last time about predictability of BTC movement. Here is a pattern I found interesting. This is not a real TA at all, just a nice pattern I spot, so no trading from my side. Disclaimer: this idea is solely for my own purposes, to satisfy the ego, if it will work out ;)
I don't know if this makes any sense nor is it precisely drawn, but I like the pattern. It reminds me on chart, posted by @Ero23. It tells me "buy now, set stop loss at 115 and forget it for about a month". Writing this, I've just bought some @214.19. Disclaimer: this idea is solely for my own purposes, to satisfy the ego, if it will work out ;)
On upside TRX will have to break over 933, where I'd enter the trade with marked targets/future pullbacks on Fibonacci extension. Stop loss for this trade is initially 835 and can be raised later. On downside, if 843 will get broken, I expect it at 780 and if this one will get broken, too, it could reach 600 level again (this is the black scenario, but one can...
If we look at long term, we can see a pattern here. ETC needs to break above 19 with nice daily close - not just break through and retrace bellow it. Also starting point from where it breaks is important - we are looking for starting point as close to 19 as possible. In the past it tried and failed twice (marked in red) - there was just break and then close...


