rossjohnson47
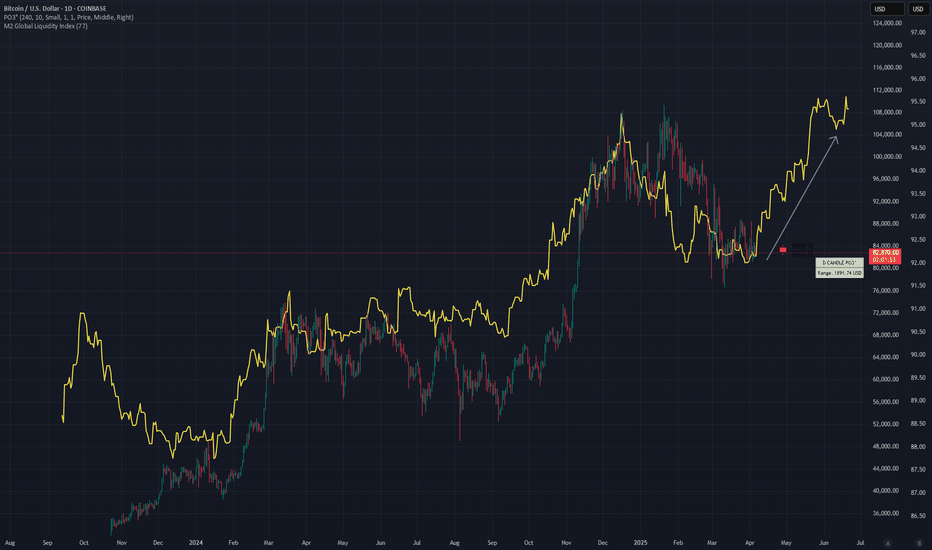
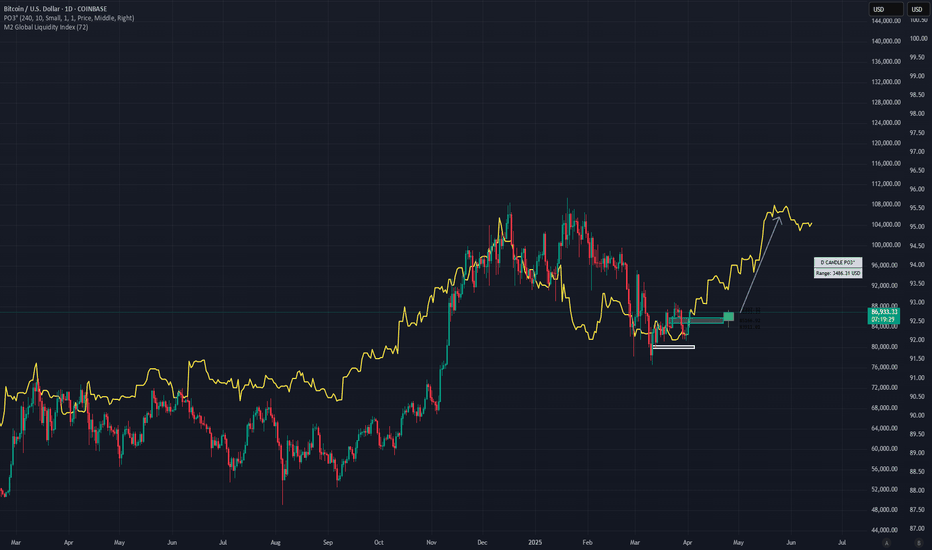
📈 BTC/USD – Liquidity Recovered, Price Reacting This chart shows BTC (candles) vs. M2 Global Liquidity (yellow, 77-day delay). M2 dropped ~4% in late 2024, then fully recovered that drop in early 2025. BTC is now reacting to that move with a delay of ~77 days, showing strength off ~$80K support. If M2 breaks out from here, BTC could trend toward $90K–100K,...
The idea that Bitcoin (BTC) and Ethereum (ETH) tend to go up around 70 days after global liquidity (M2) increases is based on how liquidity drives risk asset prices—especially in speculative markets like crypto. Here's a breakdown of why this happens, particularly with the 70-day lag: 🔍 What is M2 Global Liquidity? M2 includes: Cash Checking deposits Savings...
The idea that Bitcoin (BTC) and Ethereum (ETH) tend to go up around 70 days after global liquidity (M2) increases is based on how liquidity drives risk asset prices—especially in speculative markets like crypto. Here's a breakdown of why this happens, particularly with the 70-day lag: 🔍 What is M2 Global Liquidity? M2 includes: Cash Checking deposits Savings...
Quite an easy sell here on NQ today. We had 15m FVG, 5m IFVG, and SMT divergence from MNQ. Easy target to Asia Lows.
Inverse FVG ride the 4 hour out. the 4 hour faked and should continue to push.
For the final couple hours of this 4 hour candle, it looks beneficial to buy to Asia's high. 4 Hour low made, manipulation to form bottom wick, inverted FVG close, now buy time!
I believe gold should increase here briefly off the 4 hour FVG, however, it should ultimately fill the volume gap. Wait for strong 5m closes before choosing a direction
Gold seemed to have been faking to the upside during London and looks to drop during New York. I would rate the setup a B because the 4hr candle didn't wick to the upside. However, this could be because of heavy selling pressure.
Sells have been entered for gold! Should continue down now.
As per the chart! Expectin the market to recover today. Got a nice bounce off the Asian session.
Sell Gold based on the criteria established. Price could keep moving up and if that is the case, you should not be entering.
Just a chart showing the liquidity zone that could get filled for Credit Coin. Would be a good move to continue up.
Just putting some thoughts out there- it looks like there is about a 25% chance of a fully bearish market and the end of the bull cycle. However, there are some other possibilities that could play out, as indicated on the chart. CPI seems to be coming down, and M2 supply is going up. The liquidity is estimated to hit the market around March 24 (my estimation) and...
Bitcoin just reached the buy zone! RSI came below 30 and is looking for bullish divergence and volume is also picking up!
**Buy Render (RNDR)** The weekly RSI has dropped below 40, signaling oversold conditions and a potential buying opportunity. Beyond technicals, Render is fundamentally strong: ✅ **Leader in Decentralized GPU Rendering** – The network provides scalable GPU computing power for rendering graphics, AI, and metaverse applications. ✅ **Rising Demand for AI &...
Here's a chart highlighting how oversold Aerodrome is right now. RSI just dropped below 40 and looks primed for a rebound. Stay tuned!
Altcoin season has been delayed, with prices seeing a sharp decline over the past couple of months. However, Ethereum is flashing a potential buy signal with: 1. Increasing trading volume 2. RSI dropping below 40, indicating oversold conditions These factors suggest a possible rebound ahead.


