1. Wolfe Wave projection takes us to 420 by end of May 2. Measured move from highest high to lowest low in the past 6 months takes us to 420 3. Real support is found at 420 if we look back at 2020 4. Gap that needs to be closed in same area I have sold credit spreads (multiple) at 670/700 in June Incidentally, QQQ will likely go down as well
See smaller TF bear WW occurring with in trip down to 420
As published 10 days ago, TSLA appears to have arrived at the 660 area. Now it will either retrace to fill the gap or head down to a much lower target to touch the thick green target line well below 500!
Bear WW following course. Made a perfect point 5 with a volume surge and reversed. Often Wave 4 to 5 is straight up, but if it takes a pause as in this example, then you have two targets (red and green lines). One is aroun6 660 and the other is much, much lower below 500. I sold naked calls at 900 in June, so I will remove one when TSLA gets to 660 and hold...
Wolfe Wave analysis of TSLA shows point 5 peak reached with volume surge along with 0.786 retracement. Initial target is 660 for this coming Wednesday. Earnings are estimated at +/- 10%, but historically come in at an average of +/- 7.5 %. Which if TESLA falls per WW analysis puts us very likely at 660
See confluence of trendlines hitting resistance just as price spikes
Entered yesterday and position, via options, and ended up about where we entered minus a few $ for commissions and option spreads. Today on 195 minute bars we see a 50% retracement from yesterday, the price just at LT resistance and a very tight triangle. Plan to go short at 24.02 with target around $22 or lower.
XLF in downtrend Retraces to form triangle Cannot close convincingly above blue trend line. Stops at previous support which is now resistance and at 0.786 retracement Fractal flow shows down turn. Conservative entry is for it to break lower border of triangle, aggressive is for it to breat last 130 bar. SL just above yesterday's high. Frst TP it at 22.11
Utilities always take a hit with rising interest rates. Here we are in a downtrend and a wedge triangle forms and cannot get past long-term support which has now become resistance. Targets at both at recent low for a quick two pints and then at next LT support and Fib extension at 48.58, for another ~ 2-3 points
Wolfe wave hitting resistance and trend line. Decreasing volatility as it approaches. Fractal flow (RSI 4) showing divergence with last bar. Short beneath last 130 min bar. If you plasy options buy the monthly Febds. Plenty of open interest and very small spread. TP price along descending line from point 1. SL just 0.005% above yesterday's high. Purchase
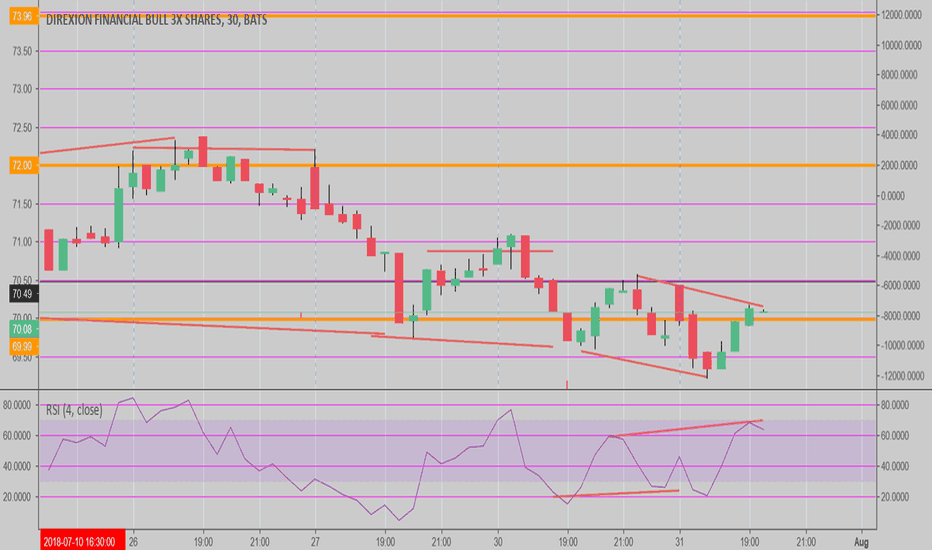
HIdden divergence on 30, 60, 90 min chart
Hidden divergence on three time periods. Price unchanged, but RSI divergence down in an up trend and just coming off support -> buy signal. TP 72.10, but could go higher RR = 1.25 Shorter TP, could have entered Friday about 90 minutes before close, with better RR. Back testing shows RR 1.25 to 2.0 with entries 3-4X/week. Only check chart 3 times a day with this method.
Hit support on USD 30 and ascending limb of triangle. Dow usually continues or reverses halfway through the day. This is a buy order at exit MOC.


