saal_eliyahu
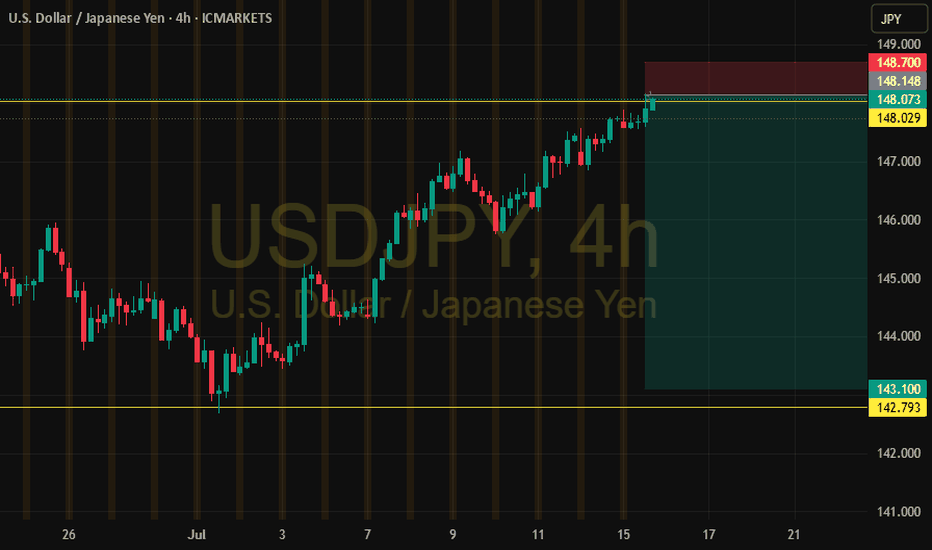
Premium🔻 USDJPY Short Setup Near Key Resistance 🔻 Timeframe: 4H Symbol: USDJPY Trade Type: Short (Sell) 📌 Context: USDJPY is approaching the psychological resistance zone at 148.00–148.50, an area that has historically triggered pullbacks. While the recent momentum is bullish, key technical indicators are flashing overbought conditions. 📉 Technical Confluence: RSI...
📊 **XAUUSD Bullish Setup (30m)** 🟡 Gold is showing a potential bullish continuation after breaking structure and retesting the lower Gann box range. 🟩 **The price is currently holding within the Gann Box**, respecting both time and price symmetry, and bouncing off the **0.382 Fibonacci level** — indicating a healthy correction in an uptrend. 📌 The confluence...
After a strong bullish impulse from the 3,297 zone to the 3,347 high, gold is currently undergoing a technical pullback. 🔍 **Key Levels to Watch:** * 📉 38.2% Fib: **3,327** * ⚖️ 50% Fib: **3,321** (Current area of interest) * 🛡️ 61.8% Fib: **3,315** – strong potential support zone The price is now testing the 50% level. If bullish confirmation (e.g. bullish...
🚩 Classic Bear Flag on Oil 🛢 A textbook bear flag has formed on the oil chart: 📏 Flagpole: From $77 down to $64 – a move of 13 points 📉 If price breaks below the lower support of the flag: 🎯 Target = $64 − $13 = $51 ⚠️ This sets a bearish target at $51, assuming momentum continues and there's no invalidation. usoil 67 sl 67.5 tp1 66 tp2 65.5 tp3 65 tp4 64.5 tp5 open
📌 XAUUSD – Bullish Flag Pattern on the Hourly Chart Gold completed a strong upward move last week and then entered a corrective phase forming a classic bullish flag pattern with a descending channel. 🟡 Currently, price is consolidating within the pattern boundaries. As long as it holds the support area around 3,325, the favored scenario is a continuation of the...


