samstoobad
EssentialA swing to ath can now be on the cards Support Demand Trend Fib
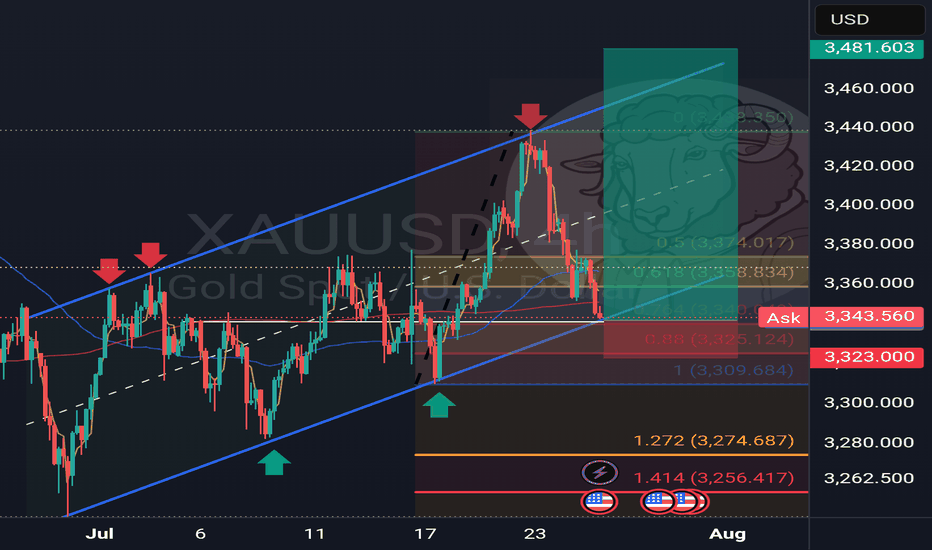
Daily Timeframe Analysis Gold continues to respect its medium to long-term bullish structure on the daily timeframe. Despite the ongoing geopolitical tensions and war-driven headlines, price action has experienced a corrective pullback from the key resistance area near 3430. Importantly, gold appears to be forming a minor bullish channel within a broader...
VWAP: Volume Weighted Average Price What is VWAP? VWAP stands for Volume Weighted Average Price. It’s a trading benchmark that gives the average price an asset has traded at throughout the day, weighted by volume. This makes it more accurate than a simple moving average, especially for intraday analysis. Unlike regular moving averages that treat every...
Last week’s analysis played out perfectly, securing over 2,500+ pips as forecasted. This move was largely driven by a blend of technical setups and fundamental catalysts, particularly the ongoing U.S. China tariff war which increased gold’s safe haven appeal. FUNDAMENTAL BACKDROP: China’s tariff hike to 125% on U.S. goods has rattled global markets, weakening...
Gold Market Outlook Post Tariff Response & Pre-NFP Volatility Overview: Last week, gold experienced a major shift as it broke from its recent bullish structure and sold off sharply. This was largely triggered by renewed geopolitical tensions stemming from former U.S. President Donald Trump's tariff remarks and China's reactive stance. These developments rattled...
Gold Market Update & Analysis: Next Targets and Key Levels After Saturday’s analysis, both buy targets have been successfully reached as expected. The market opened with a gap up, which invalidated the short setup due to resistance being broken, triggering further bullish momentum. As a result, both our buy targets were hit, reinforcing the overall bullish trend...
What can we expect next for gold? Weekly time frame Gold continues to demonstrate strong bullish momentum, with no significant signs of weakness on the higher time frames. The weekly structure remains intact, forming higher highs and higher lows, signaling a continuation of the uptrend. Fibonacci analysis shows a clear break and retest of the 1.414 level,...
Market Recap & Key Developments Friday saw a notable shift in momentum as bearish pressure led to a significant pullback from recent all-time highs. This move created a swift correction, filling inefficiencies left behind by the previous bullish impulse. On the 4-hour timeframe, a well-defined head and shoulders pattern formed, with the neckline breaking at...
Gold Market Analysis & Outlook Weekly Overview with Technical & Fundamental Insights Fundamental Overview Stagflation Concerns: Slowing global economic growth combined with high inflation is keeping investors cautious. Federal Reserve Stance: Markets anticipate potential rate cuts later this year, which could boost gold prices. Geopolitical Uncertainty:...
Reviewing Last Week’s Precision Play Last week’s analysis played out flawlessly, securing a pinpoint entry that ran to full target for over 900 pips. The synergy between technical and fundamental analysis was spot on, reinforcing our ability to anticipate price movements with precision. Gold’s bullish momentum was driven by a combination of technical...
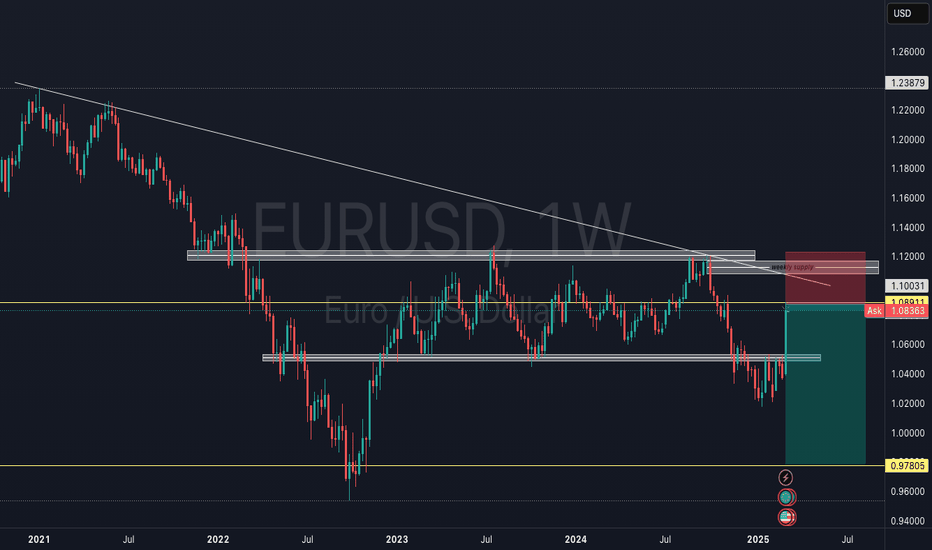
The past week saw a significant break of resistance on the weekly timeframe, without a subsequent retest. Price has since retraced to the 0.618 Fibonacci level, indicating a potential correction before the next major move. Additionally, the weekly timeframe highlights a strong resistance level, an overall downtrend, and a well-defined weekly supply zone. These...
Today, we will break down candle exhaustion and how to use it for high-probability trade entries. We will analyze a bearish engulfing pattern, the role of trendline breaks, and how we combined this with the ORB strategy at the US open to secure a strong entry for the 2905 target. What is Candle Exhaustion? Candle exhaustion occurs when price action slows down...
The Secret Gold Level Revealed: The Power of 7 After extensive backtesting and observation, I am finally ready to reveal a key level in gold that has remained hidden in plain sight. We all know the importance of round numbers, psychological levels, and the Quarter Theory in trading. But now, we introduce a new concept—the power of 7. The Magic Number: 77 No...
This past week, gold faced strong bearish pressure, closing with a weekly bearish engulfing candle. The daily timeframe reinforced this sentiment with two consecutive bearish engulfing candles, breaking a major structure at 2880. However, Friday provided an opportunity, as we caught the falling knife, entering a long position at 2833, the week's lowest...
Fibonacci Golden Zone Pullback & Shorting Opportunities Price is pulling back into the Golden Zone of the Fibonacci retracement, filling the imbalance and tapping into a supply zone. This area is key for potential reversals creating a lower high. 🔍 What to watch for: ✅ Bearish Rejections – Engulfing candles or wicks signaling weakness ✅ Market Structure Shift...
Last week's analysis saw a perfect entry with our trade running right into profits. Looking at weekly time frame we can see price broke support to create equal lows before its retracement back. Inline with our counter trend trade back to resistance. As said in last week's analysis we had a supply zone to watch out for which price has reacted to. We can...
Bullish Channel Holding For Now Silver remains in a bullish trend, respecting the channel structure. However, the 50% retracement level has acted as strong resistance, leading to a bearish engulfing candle as the week closed both on the daily and 4 hr timeframes. Potential Pullback Incoming? A bounce may be seen this week, at the channel trend and...
Gold is definitely at an interesting inflection point, with both bullish and bearish scenarios presenting strong arguments. Let’s break it down further: Bullish Case 1. Strong Trendline Support – The ascending trendline and price action suggest bulls are still in control unless we see a decisive break below 2920. 2. Golden Zone Confluence – Fibonacci...


