sanjaynakhale
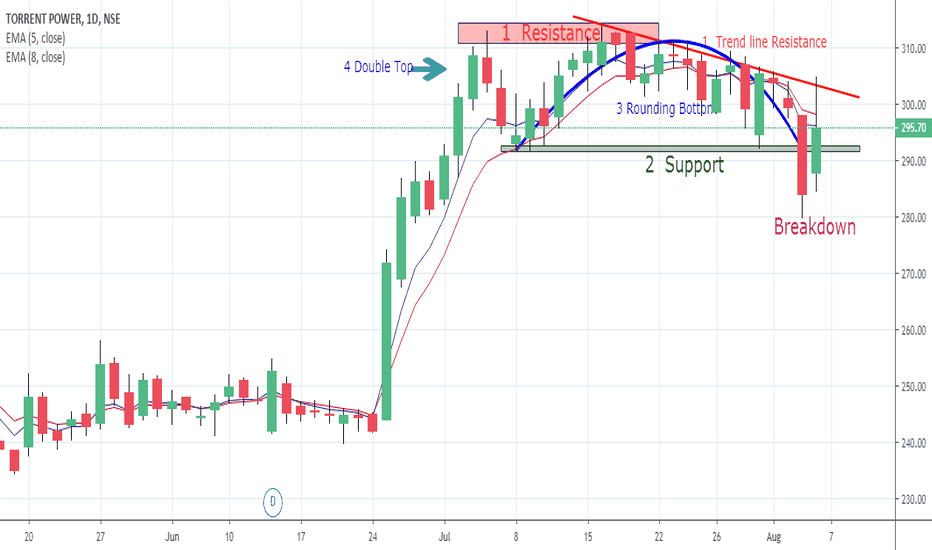
Daily Chart Observations Point no.1-Resistance– 1) Previous swing high resistance. 2) Trend line resistance. Point no.2-Support-previous swing low support. Now the price has broken the support area. Point no.3-Rounding Bottom Pattern– Bearish Pattern Point no.4- Double top Chart Pattern – Two tops at the resistance area. Point no.5-Breakdown– 1) Price breaks the...
Point no.1 - Suppor t– Look at the downward sloping blue line is acting as a support. 3 times the price reverse price from this area indicates strong support. Point no.2 - Resistanc e-Look at the downward sloping red line is acting as a resistance. Now the price is facing the resistance. Before that 2 times the price reverse from this area. point no.3 - Channel...
Daily Chart Observation Point no.1-Resistance– Previous swing high resistance. 3 times, price reverse from this area. Point no.2- Support– Previous swing low support area. 2 times, price bounce back from this area. Point no.3- Rectangle Chart Pattern.– Price is trading in the range formed the rectangle pattern. Conclusion From the above chart, it is clearly...


