schuck15
I didn't take this setup due to Brexit. Fuck me
Recently had a 4 touch S/R flip. The Daily MS is bullish along with the current hourly. Setting limit orders to enter on a pullback on the top of the previous resistance. I have set take profit at first area of resistance, which will "pay" for half my stop. The next take profit is at the next Daily resistance.
I don't know what will happen here. I thought that there was some good resistance in this zone from the supply and OB, but this candle looks like it might clear it out. I think this becasue there was such a strong upcandle just before. Not sure what's gonna happen, but I'm not gonna take that long. the R:R is only 1 and there is a weekly downtrend occuring
3 touches and it being a Macro s/r line give this H4 s/r zone a lot of significance. Currently in a downtrend. Use half size and lower targets.
Bitcoin has recently formed the pattern of retracing to the 0.618 to 0.786 level. Personally, I think that there will definitely be a break above the 0.786 Fib because too many retail traders have caught on to the pattern and are now planning to short in that area. That being said, I think the big players will push price past that point set off stop losses, giving...
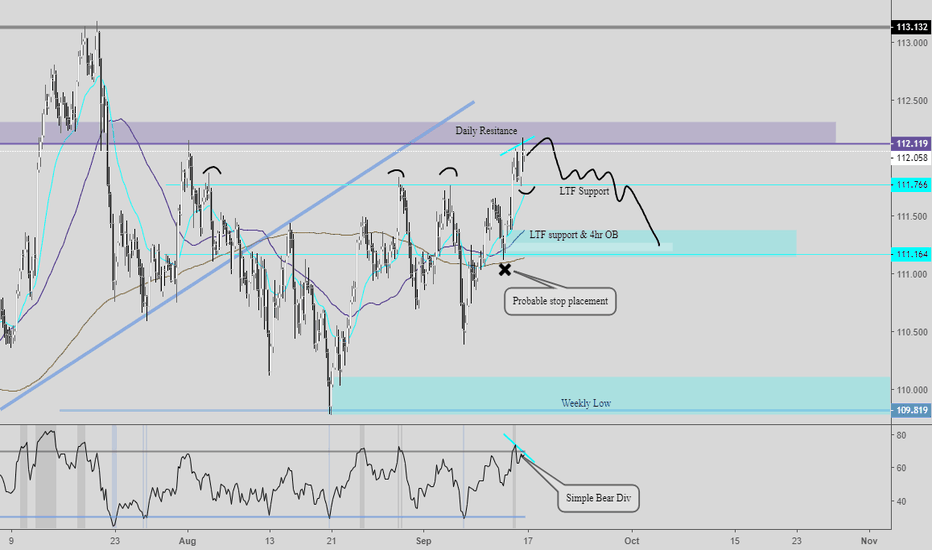
I believe there will be a bounce off of resistance (confirmed off of 4 hour RSI) and a return back to the stops for liquidity.
XRP is a coin that everyone hates but always seems to pump hard. Recent pick up in volume signals accumulation to me. This along with a bullish TK cross make me think XRP is headed across the Low Volume Node to the edge of the HVN. There is some nice confluence here with the edge of the HVN and previous horizontal support.
AUD/JPY broke below the demand zone on the third touch in a downtrend. There may be a retest into the demand zone, but I think the trend will continue. I put my stop above the demand zone and the Tenakan-Sen. I will close on a close above the demand zone, the kijun, or a strong bull div (although I will just reenter at a higher point during a simple bull div)
Two of the 4 conditions for a Kumo Breakout Short entry have been completed. All that needs to happen now is Chinkou Span breaking below price and there needs to be a bearish Kumo Twist.
AUD/USD has been in a triangle for a while and just broke down. The weekly trend is down along with the daily. It also broke below a past horizontal support line riding the bottom of the BBand.
Recently Broke down from an ascending wedge. Looking for a kumo breakout here to the downside. Will wait for the close
I expect this trade to go slowly due to Weekly MA resistance down below. The Daily Order Block resistance should bounce and then break. It will then be flipped from support to resistance. Weekly Ichimoku is currently in a downtrend, but there has been a strong simple Bull div on the RSI and there is a C-Clamp. I expect this trade to not last too long and will...
This is nearly a perfect example of a Kijun Bounce. RSI has reset to near 45, perfect bounce off of Kijun, rejection near middle of BBand. All 4 conditions have been met for this trade: Chinkou below price, Bearish TK, Bearish Cloud, and price is below the cloud. I am however a little late on this entry, but I am still happy with it.
I took a nap earlier today and missed this opportunity to enter at the last daily close. I will still enter with smaller size because the possible R:R is looking bad with that trendline (R:R of slightly above 1) (I never take trades below that) and the Weekly kijun and Tenkan are both Pointing Down.
RSI formation broke down showing trend continuation along with the ichimoku trend indicator. Along the Horizontal Support line there have been 3 touches already. This or the next touch will most likely break the S/R level. I will add when it closes below and on the retest of the S/R level if it happens.
On my weekly analysis of this chart www.tradingview.com we are in a long term uptrend and I will only look to go long on the daily and use the 2 hour for entry zones. The text boxes on the chart show important S/R zones and where I will be going entering my long. The daily Ichimoku is in full bull mode and just broke up out of a triangle. This is and the weekly...
On my weekly analysis of this chart www.tradingview.com we are in a long term uptrend and I will only look to go long on the daily and use the 2 hour for entry zones. The text boxes on the chart show important S/R zones and where I will be going entering my long.
RSI Breakdown and Bearish TK recross preceded price breakdown out of formation.


