scottammons1
PremiumThey say hindsight is 20/20. I was reviewing some stocks I follow today. Saw here where C has pulled back to the long-trend DMA,and that just happened to coincide with the Fibbo gold bar retracement and the trend line from earlier that it has touched a couple of times. An approximate 3-day consolidation and it is off to the upside again. Here is where I could...
It appears when looking at the weekly, CRM began an uptrend starting Dec '22. On the daily, the Fibbo retracement looks to have pulled back to the bottom of the golden retrace range. With both of these being touched, along with the 80 DMA on the daily, is CRM ready to run again? If so, it looks to be able to run to $400 before topping out in the channel.
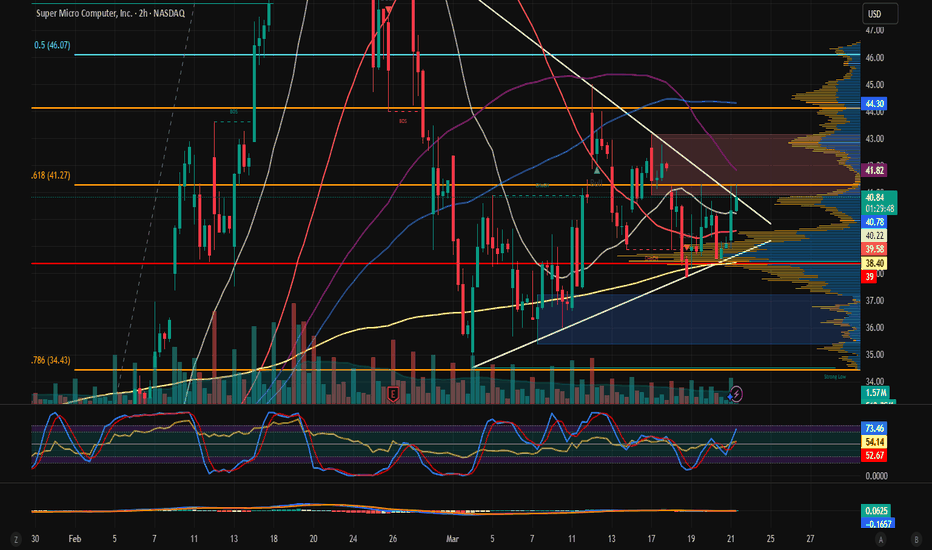
SMCI pulled way back from its high last month and has been forming what looks like a pennant/wedge. Is it breaking out to the upside now?
NYSE:BEKE looks like a bull flag as well with large volume spike on the Bull pole.
Take a look at the NASDAQ:BILI chart, esp on the weekly. It looks like a bullish flag to me. Do you own DD, and I am going to dig more into this. Support looks to be in the $18.19 to 19.07 range. Came back to the 50 dma on the weekly. Volume up on the flagpole.
I like that the price it has pulled back to coincides with the previous high in Jan, '22, which became resistance in Dec '23, and that the 0.50 Fibo retracement is in the same area. It needs to hold and find support here. If so, the next leg up should be ~75-100%?
I really like the chart here. On the monthly/weekly charts you can see where ASML has pulled back before to the red DMA, the Fibbo retracement also hits at the $648 level where it bounced, and previous S/R looks to be in this area. It bounced from there and is now going up again. Longer term B&H.
Looks to have a strong up trend on the weekly chart and just bounced off it. Next resistance looks to be around $582? Pick a short term pullback to $535 or go ahead and enter at $552?
Has WM finished a consolidation and looking to head up? C&H
It looks like APH has consolidated and now breaking to the upside. The MACD and STOCH looks good as well.
It looks like APH has consolidated and now breaking to the upside. The MACD and STOCH looks good as well.
Wolf came up and touched the downward trend line almost perfectly. WOLF appears to be a company with a lot of upside but the chart looks to be pointing to another leg down?
NYSE:DELL looks to have established a new uptrend with higher lows, higher highs. OH Resistance looks to be $135, so another 6-8% to run.
NFLX has formed a nice C&H on a rising trend. Based on the leading edge of the cup to the bottom, should expect about a 12% rise from here.
The downward channel I was showing for TSLA looks like it has been broken. I figured it would take another leg down if the channel continued, so I sold. Looks like it has been broken. Looking for a retest of new support and then move higher.
Is TSLA about to bump the down trend line and make the lower high with a next leg down, or is it about to break to the upside?
Did it just run out of the channel or is it now using that as support trend line?
I like the double bottom ABT just completed. RSI is trending up. The pullback over the last week was on decreasing volume. Looking for a leg up from here.


