1. Market Overview: Bullish Momentum Current Trend: Gold is in a bullish phase, supported by price action above key moving averages (e.g., 50-day SMA/EMA). Immediate Targets: Target 1: 3571 (near-term resistance from Fibonacci extension). Target 2: 3747 (alignment with historical highs and harmonic patterns). Key Support: 3330 (round number + confluence of...
Understanding Our Approach: High-Probability Reversals with Price & Time Analysis Hello Fellow Traders! We often get asked about the core principles behind our analysis here on TradingView. Today, we want to share a key part of our methodology: how we combine Price Analysis and Time Analysis to pinpoint potentially high-probability reversal signals in the...
Dear Trader, I’m excited to share my latest analysis of $Subject with you! This report uses advanced mathematical strategies to pinpoint potential market reversals—both in price and timing—to help you trade smarter. What’s Inside? ✅ Price Targets: Clear horizontal lines mark key support/resistance levels (north/south targets). ✅ Timing Tools: Vertical lines...
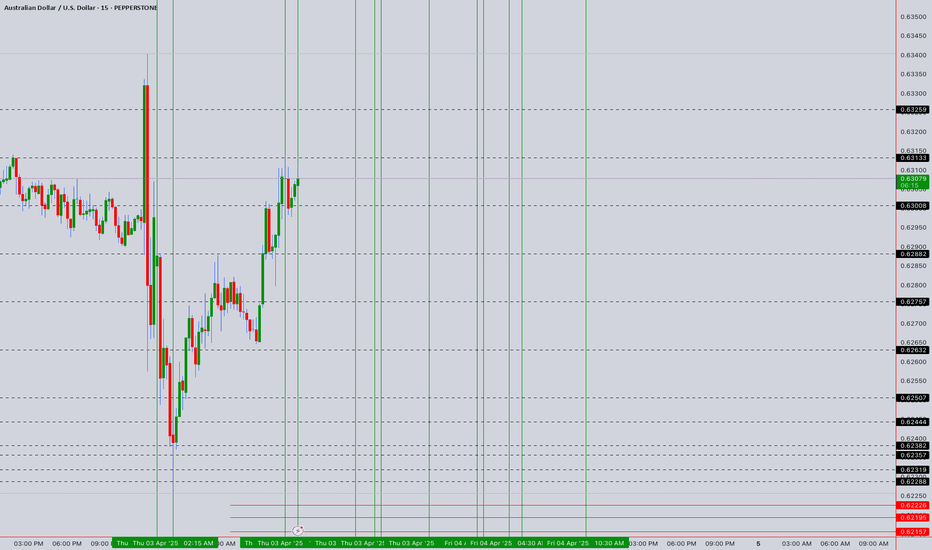
Dear Trader, Please find attached my analysis of $Subject, which uses mathematical calculations to identify potential reversal times and price levels. The analysis details projected south and north price targets (horizontal lines on the chart), along with estimated time frames for possible reversals (vertical lines on the chart, accurate to within +/- 1-2...
Dear Trader, Please find attached my analysis of $Subject, which uses mathematical calculations to identify potential reversal times and price levels. The analysis details projected south and north price targets (horizontal lines on the chart), along with estimated time frames for possible reversals (vertical lines on the chart, accurate to within +/- 1-2...
Dear Trader, Please find attached my analysis of $Subject, which uses mathematical calculations to identify potential reversal times and price levels. The analysis details projected south and north price targets (horizontal lines on the chart), along with estimated time frames for possible reversals (vertical lines on the chart, accurate to within +/- 1-2...
Dear Trader, Please find attached my analysis of $Subject, which uses mathematical calculations to identify potential reversal times and price levels. The analysis details projected south and north price targets (horizontal lines on the chart), along with estimated time frames for possible reversals (vertical lines on the chart, accurate to within +/- 1-2...
Dear Trader, Please find attached my analysis of $Subject, which uses mathematical calculations to identify potential reversal times and price levels. The analysis details projected south and north price targets (horizontal lines on the chart), along with estimated time frames for possible reversals (vertical lines on the chart, accurate to within +/- 1-2...
Dear Trader, Please find attached my analysis of $Subject, which uses mathematical calculations to identify potential reversal times and price levels. The analysis details projected south and north price targets (horizontal lines on the chart), along with estimated time frames for possible reversals (vertical lines on the chart, accurate to within +/- 1-2...
Dear Trader, Please find attached my analysis of $Subject, which uses mathematical calculations to identify potential reversal times and price levels. The analysis details projected south and north price targets (horizontal lines on the chart), along with estimated time frames for possible reversals (vertical lines on the chart, accurate to within +/- 1-2...
Dear Trader, Please find attached my analysis of $Subject, which uses mathematical calculations to identify potential reversal times and price levels. The analysis details projected south and north price targets (horizontal lines on the chart), along with estimated time frames for possible reversals (vertical lines on the chart, accurate to within +/- 1-2...
Dear Trader, Please find attached my analysis of $Subject, which uses mathematical calculations to identify potential reversal times and price levels. The analysis details projected south and north price targets (horizontal lines on the chart), along with estimated time frames for possible reversals (vertical lines on the chart, accurate to within +/- 1-2...
My Tape reading NAS100 - 24h expiry on 1H Candles We look to Sell at 19141.2/19167.0 (stop at 19200.0) Our profit targets will be 18272.0 Risk Disclaimer The trade ideas beyond this page are for Education/informational purposes only and do not constitute investment advice or a solicitation to trade. Shunya.Trade does not guarantee the accuracy of this...
203.4 would be our final tgt, to touch north it has to travel crossing few levels in coming month we will keep track of Once it crosses above 135.51 and get more bullish, we will add more. Then it has to cross 152.77 & 162.90 once these tgt are in play we are looking at 191.43 and final 203.4 Risk Disclaimer The trade ideas beyond this page are for...
My Tape reading Gold - 24h expiry on 4H Candles Posted a pin bar(inverted hammer) formation. We look to Sell at 2390 (stop at 2396.5) Our profit targets will be 2363.5 and 2357.5 Price Watch @North: 2406.0 / 2433.0 / 2438.0/2465/0/2473.0 Price Watch @South: 2363.0 / 2357.0 / 2327.0/2327.0 Risk Disclaimer The trade ideas beyond this page are for...
Bullish and Bearish EURUSD Outlook What we see we trade, as we are end of Sept 2023 last weekly of trade playbook for EURUSD. Monthly Playbook As we have witness 38.2% of Fibonacci scale multiple touches at the same time RSI 8 is crossing from top to RSI 13. (RSI 45.78) As we see we are bearish trend. To read the same after July candle inverted candle. ( ...
EUR/USD Bullish and Bearish Playbook. Multiple M and W are getting create while price revisiting south side of area. Trade wisely what you see trade
EURUSD 4H Bullish & Bearish and M and W. Double tops and bottoms are important technical analysis patterns used by traders. A double top has an 'M' shape and indicates a bearish reversal in trend. A double bottom has a 'W' shape and is a signal for a bullish price movement. Double top and bottom formations are highly effective when identified correctly....


