sinkswimortrade
EssentialExpecting a move up to the resistance around 13.5 region after bouncing off the fan line... Indicators still pointing upwards A close above that black resistance will be highly bullish for the next move higher.
Expecting the chart to fill the gap to about $180. Entered the trade when the price was about $196 . Did a bear put spread (Buying the 200 Dec put option and selling the 180 Dec put spread) . Weekly and Daily pointing to further downside. MACD heading down. $180 is the next support.
Expecting it to retest support about $260. Entered the trade with January Puts
Initiated a call position on Friday, expiring this Friday. Stock price was around $157-158. Will start taking profits from the $162 level.
Uptrend for TWLO. Looking to test resistance at 150. MACD Crossover and Stochastic heading upwards. Entered at 140.5.
The index needs a pullback and it should come very soon. Expecting 312-315 be where the turnaround could happen and i’m loading on put spreads and VIX call spreads. Dec 15 is the next stage of tariffs and could be the latest to see a pullback or a stretch leg up. Started loading on the 312/301 put spreads. Will continue to average out if necessary. Time to take...
Roku technicals is heavily overbought now. Expecting a pullback to around 151 level before a possible next leg up.
Ascending triangle on day chart for Cisco. Looks like going to test resistance and maybe a breakout. Entered at 55.7 last week.
SPY has reached its all time high and due for a pullback. Initiated Buy July Put on 21 June (Fri) and doubled position on 24th June (Mon). Short term term trade. Will close and take profit within $288-290 region. Weekly trend is still maintaining uptrend for now... Therefore the reason for a short term July Put option.
MACD has just crossed and reversed on the day chart. Stochastics also reveal in overbought conditions. Movement is to the downside now. Expect it to drop to around $180-$200 range near the 200 day moving average. Stock is extremely overpriced at more than 100x PE
BIDU Short term bullish to around $176 represents a possible short term trading opportunity. Looks to bounce off the trendline. Note that earnings report on May 17.
MACD, Stochastic and RSI all reversing and bouncing off the top of the bollinger band. Opportunity to short on the pullback. Price expected to drop to $132 where the 50day average is and if it breaks that support, possible drop to $120-122 region on the trendline support.
Hammer + Confirmation on Lyft. Take a ride to the resistance... Note that earnings out on 7th May.
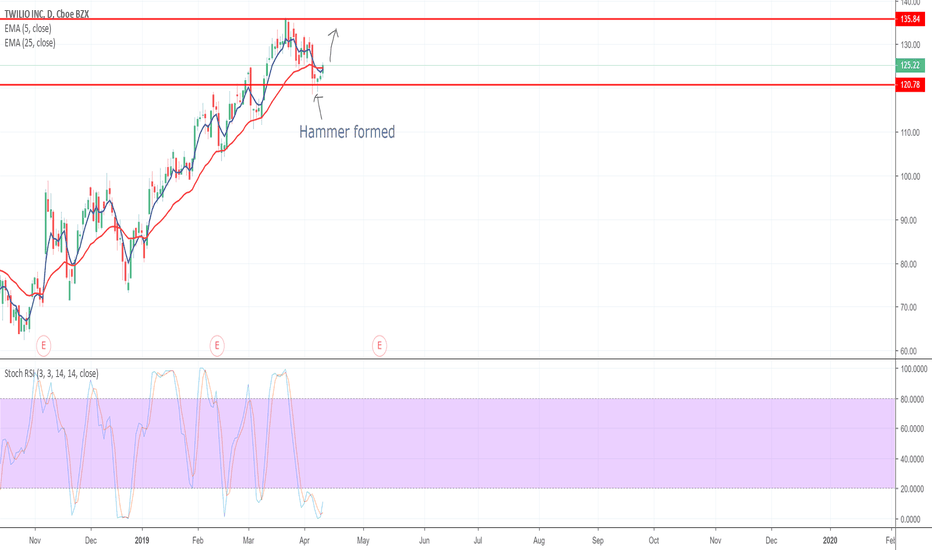
Hammer confirmed for reversal. TWLO could move up to 135. 25 Day EMA cutting below 5 day EMA. Strong momentum up expected.
Bidu reversal and moving down. Falling to next support on trendline around 166.


