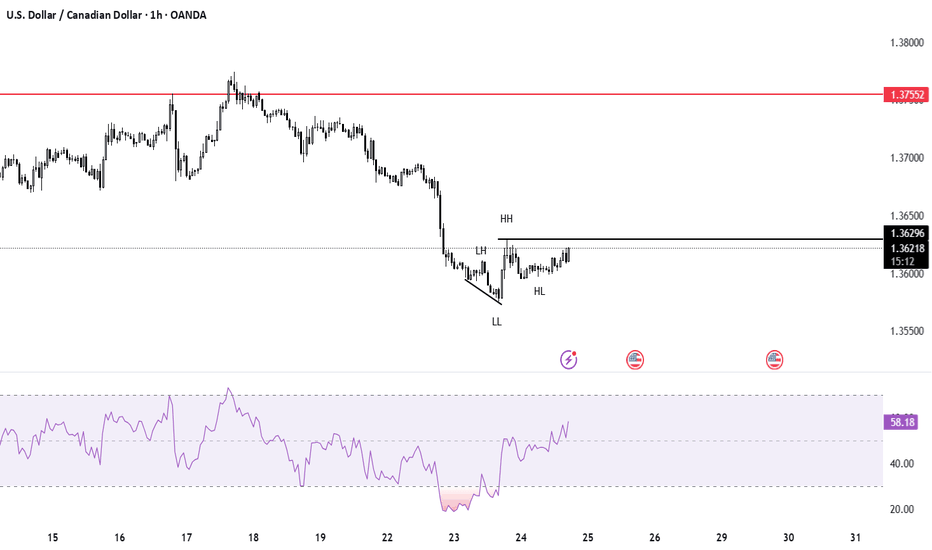
ABCD pattern Rsi div Trend reversal 3 bull point to buy comment if you have any bearish point.
3 Bull points RSI div Major trendline and hoping to reversal trend 30min timeframe very soon... Buy stop order RRR 1:2 Hold for 3430 for more gain but manage your risk
Second scenario BTC aim for 100k In first scenario we see that RSI divergence and last time 70% retracement but last time it's not flag pattern So what you think, trade with SL and proper risk management.
3 bull points Rsi div Trend reversal Double bottom at 1D timeframe RRR 1:2 hold for more longer but with proper risk management..
RSI Divergence spotted – a sign of possible trend reversal. Trend Reversal forming on the chart – momentum shifting towards upside. Company Insider Buying – Engro executive bought shares worth Rs. 20 crore, showing strong confidence. 🔹 3 Bullish Signals
Don't predict just move according to market Manage your risk before go to trade Flag pattern also confirming market still continue up Strong resistance level looking for break if it broken market make new higher high TP 75 to 82
Bullish flag Strong resistance breakout 2 bull points Position trade spot buying Bitcoin completing timecycle on oct 2025 after that it would be 4th time if market again crash for around 70% Manage your risk in both future and spot trading Note: NO analysis would 100% profitable trading is the game of probability and risk management so follow your trading plan...
Reversal of pattern Rsi divergernce 2 bull point RRR 1:2 breakeven after 1:1 Risk 1, 2%
Still XAU making HH and HL It has to retrace before going for another HH Seasonal analysis showing same previous 5 year data XAU Bearish from 23 Feb to 2 Mar then Bullish from 3 Mar - 20 Apr So, instead of this week retracement and consolidation I look for trade bullish trade next week.
Bullish trend making HH may go down for HL Rsi divergence Reversal pattern falling wedge Manage your risk before entering position in real account.
RSI divergence needs to be confirm use buy stop at last Higher low or wait for HH and HL then Higher low to be good entry Harmonic pattern
major trendline on 1d timeframe RSI divergence Reverse of trend HH and HL Risk 1:2
Swing trade Wti looking for reversal 3 Major bull points Trend reversal Rsi divergence Reversal chart pattern Head and shoulder Manage your risk before putting trade on real account
Past Cycle Behavior: Bitcoin showed strong bullish momentum in the past. Many positive news updates came for Bitcoin and blockchain. Despite this, Bitcoin completed its cycle and dumped for 13 months. Current Market Situation (2025): Bitcoin is now completing a 33-month bullish cycle in October 2025 (similar to past trends). RSI divergence is forming, which...
Based on time cycles, BTC remains bullish heading into 2025. If it retraces back, it might form a higher low (HL) on the weekly timeframe.
After previous US elections all times Oil prices increase but in 2012, 2016 it increase for some level and then drop. So looking at the previous chart data we expect increase 68$ to 94$. and then maybe it drop because of EVs and global warming.
On the weekly timeframe, the DXY (U.S. Dollar Index) is bearish. It's showing a final jump before heading down to create another lower low. According to this analysis, other markets might be retracing. I'm observing XAU (Gold), BTC (Bitcoin), and US Oil (WTI Crude Oil) For potential retracements, manage your risk and emotions before diving into...
based on previous chart data RSI divergence tell us BTC now looking for dump. last time BTC retrace to 70% and now it again retrace 70% mention as buying zones. Also see the second scenario......


