sshussaini
PremiumBitcoin is in a bullish broadening wedge pattern! Bitcoin tested key diagonal trendline support (on log scale) as marked by yellow arrows! Trump's inauguration on January 20th, 2025, marked the local top, and now I expect the Trump tariff day event on April 2nd, 2025, to mark the local bottom, which can lead to a massive move to the upside in the coming weeks...
Bitcoin's recent dump to 74Ks made me redraw some diagonals but these diagonals make perfect sense for a bullish reveal to new All Time Highs! Bitcoin tested the following supports when it dipped to 74Ks - 1) Yellow diagonal line connecting the two 2021 tops and the 2024 tops! 2) Cyan color falling wedge digonal 3) Red diagonal parallel channel support 4)...
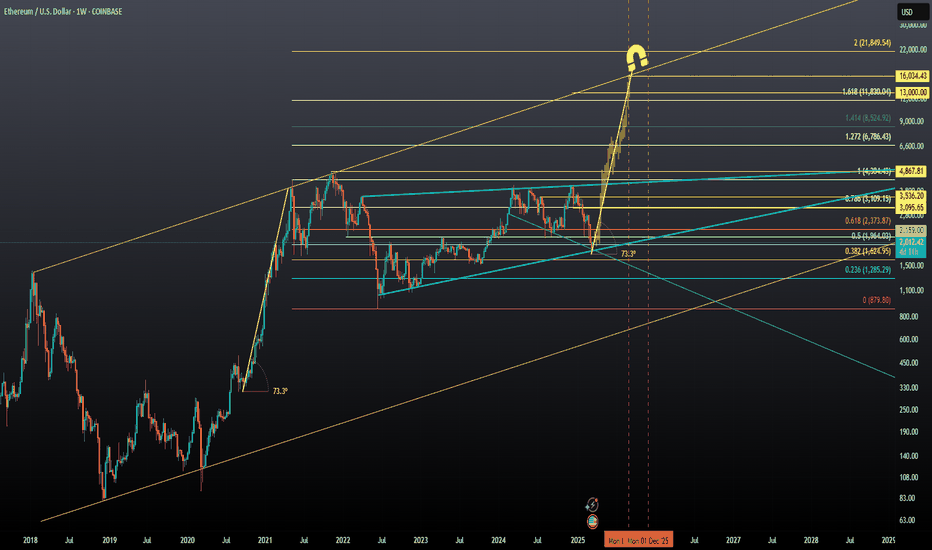
Ethereum is in a bullish wedge pattern! It is pretty undervalued now at $2000! I believe ETH will pump hard in 2025, with the ambitious targets on the chart projected to be reached between September and December 2025. Also, remember now ETH is the largest holding of World Liberty Financial the invest group of the trump family!
OTHERS.D on the monthly chart is holding on to a monthly diagonal support and is yet to breakout from this Multi-year triangle. A Breakout of the diagonal resistance can bring upon a massive altseason to take Altcoin dominance to 19.5% and if things get really bullish than the dominance can higher levels as well in Q4 2025! 4-year time cycles suggest Altcoin boom...
It appears OTHERS.D made a double bottom at 7.8% prior to a huge bullish move and made a bear trap by breaking the monthly trendline on this monthly chart! The projection remains the same Bull market target of Other.d may come to fruition anywhere from October to December 2025. I remain bullish on Altcoin dominance going forward !
Bitcoin broke down from a Head & Shoulders pattern. In this video, I am explaining this drop can continue to 10,200 to 9700 . Not financial advice.
Link appears to have bottomed in the golden pocket of 0.5 to 0.618 fib levels and is gearing for a move UP to the resistance levels in the video !
Bitcoin has been in this large triangle with diagonal support and diagonal resistance lines. The move from 3.8k low to the 9.4k high was an impulsive move signalling a trend reversal in my opinion. The MACD indicator on the weekly chart has crossed bullish and the last two times this happened bitcoin rallied from 3000's in Feb 2019 to 13.8k and this year it...
Bitcoin pumped at 6400 support similar to how it pumped from 5873 support like I had anticipated. Now Bitcoin on 1-day chart flipped 6990, 21-day EMA & 50 MA as support. Look at how similar Range 1 and Range 2 are with both ranges ending in a bear trap. I am now expecting Range 3 fractal on the chart to become a reality. 8K incoming as top of projected Range 3,...
The weeks ahead will determine if bitcoin is going to go parabolic before the halving event in May. The price is trying to break the 6-month downtrend channel. The breakout should occur with good weekly VOLUME to close above the upper diagonal resistance of the downtrend channel. Conditions for a confirmed trend reversal into a bull market - 1) Break above 8.5K...
BTC about to break or test the diagonal resistance of the bull flag pattern at 8700. Resistances on the chart. Daily RSI >70 for the first time since July 2019. Volume building up. Resistances on the chart
WANChain has pushed through the resistance at 100 day EMA and is coming out of a 2.5 month consolidation post its most recent pump in late august. Resistance levels on chart. Green line - 200 day MA.
VETBTC appears to be forming an ascending triangle on 4hr chart. The chart is making lower highs. Resistance at 94 will eventually be broken. Support of the triangle is at 85 sats. RSI is an upward trend on 4-hr showing bullish divergence. Lower highs are a good buying opportunity with tight stop loss. Expecting a test of 100 sats soon.
VETBTC has been rejected by the 200 DMA (63 sats). Volume declined and did not follow through for close above 200 DMA and higher prices. RSI went into overbought territory and is cooling down now. Next support is 50 sats but it looks like it is more like the price will go down to 46 sats which is 0.618 fib level. Right now the chart show it is a short opportunity....
VET has consolidated and bottomed for a while now. VETBTC is about to breakout of an ascending triangle pattern on 1-day chart. A close above 50 will be the confimation. Resistance 50 sats which if flipped to support will test 61 sats. Levels on the chart. SL - 47 (4% below 49); Take profit - 61 and maybe moon with trailing stop losses.
EOS has turned bullish with the golden cross of 10 DMA with 20 DMA. 10 DMA has acted as support. Resistances are shown on the chart with an upside potential of 35%. Target - 30% profit from current price of 4.11. SL at 10 DMA at around 3.8.


