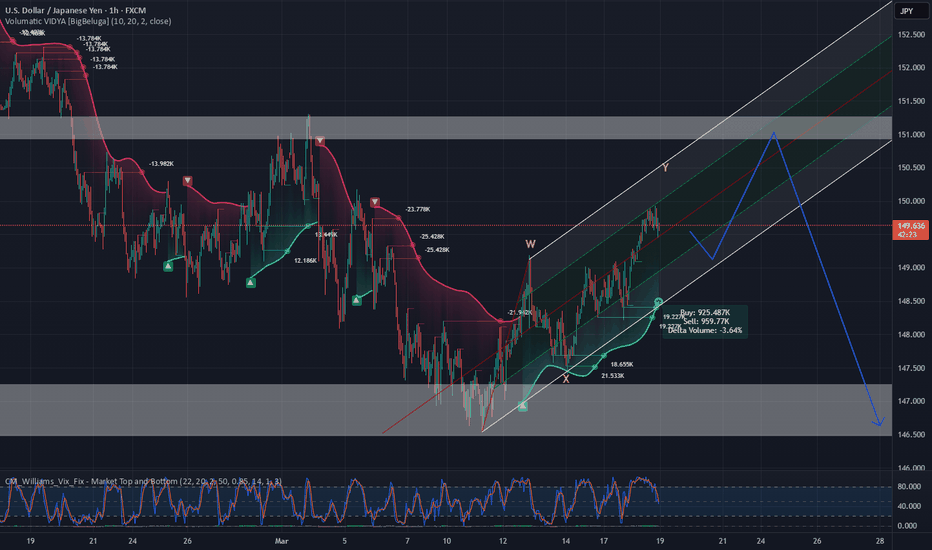
Am bullish as my support region is holding out. Bullish at least for the short term with price ideally retest my resistant region
Price breaks short term support region, very simple support and resistant view, if price stays below, the bias is for another leg lower
Nice push, expecting short term bullish push up, ride the wave and collect some $$$$$ Good luck
Highly possible that the current spike down is the confirmation of a trend change, short term at least. The strong break of the ending diagonal suggest a deeper move down, perhaps towards the lower support region before another attempt higher. Good luck. Give a boost if you like my sharing.
As price broke above the ending diagonal strongly, my bias is now bullish for usd, it should rise higher before another leg lower. Good luck
Time wise, this correction down is quite short in time, bulls can push for another new high but i believe it will take longer and more side ways before the actual move up. Short term, i am entering both long and short for scalping, expecting price to be support at least for the short term. Good luck.
Expecting another leg lower, but if price unable to move down strongly and break channel, price will continue higher
Waiting to see if price reverse and close below first support region and the ED or spike higher. Will become short term bear if so. Good luck.
waiting for a clearer and better entry level, just a possibility, work in progress
Playing out as expected, now we ride the wave down and make some $$$$$
Price break above resistant/support region and retest it. Price should go higher if support hold
Unless there is a big move down the bullish channel, the bias is still bullish in the longer term. You never know, the "tariff" thing is still on going, just one sentence from trump could cause bulls to push it back up. For now it is work in progress.
Same as eurusd, price structure seems to suggest a triangle pattern If this works, price should break lower then retract, waiting for CPI data before new low(?)
The messy price action seems to be an ABCDE triangle, price break below to confirm Work in progress
Lower time frame still suggest continuation lower Waiting for price to hit new low before deciding next move
Need price to hold below, if we see an hourly bearish candle, that is a bonus and hint that further drop is coming. The move up after NFP is strong, if bears can stop it under the breakdown line plus a bearish candle, this could be a classic draw in the crowd for a fake move up before lower. Too earlier to know, but look good if the hourly candle give a good...
15 mins time frame show a clear 5 waves up, this suggest a start of a bigger move up after a correction lower. Will affect eurusd gbpusd bulls as when dxy aka usd moves higher, they move lower
Daily chart suggest a deeper correction before lower. For wave analysis, it is what we call expanded flat, where A and B waves are 3 waves follow by wave C in 5 waves. Still a long way to go before we can find out if this works. Bulls need to hold 101.65 and 100.57


