startrader143
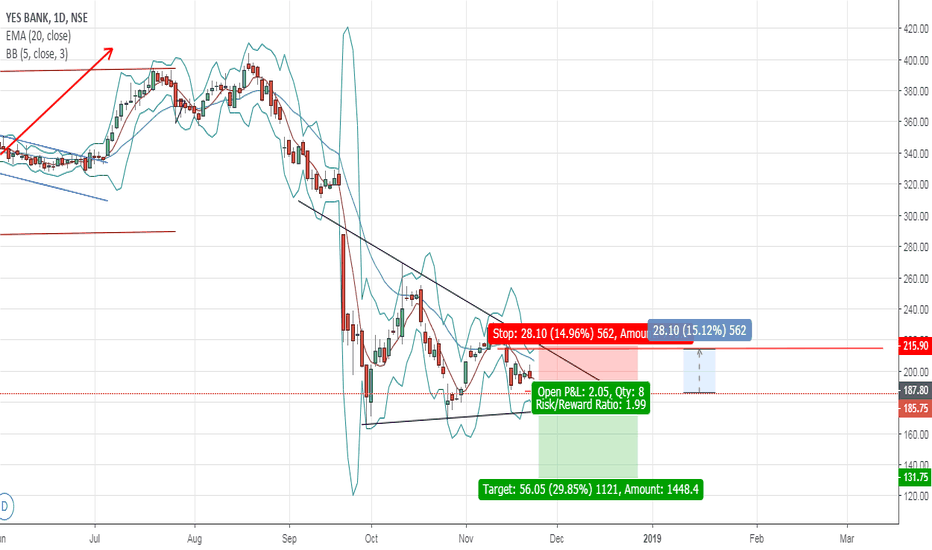
Based on the Price action i feel we can enter the SHORT TRADE as per the SHOWN RISK REWARD in YES BANK....
As i predicted earlier USOIL now in a strong RESISTANCE ZONE.. in 1 HR time frame BEARISH BUTTERFLY pattern is completed so pls watch this zone carefully.... Now USOIL will take a little relief to get power to go UP... THANKS for WATCHING....
Hope we can expect a downside movement upto 680 in the TITAN Because of HEAD SHOULDER Pattern .... Hope 680 is the next SUPPORT..
There is a STRONG RESISTANCE ZONE in $72.91 to 73.20 Because in the daily timeframe i found BEARISH GARTLEY & CYPHER with the confluence of ABCD pattern too... So traders pls be watchful in this ZONE.....
We can go short with HCL TECH as like RR shown in the CHART because of BEARISH GARTLEY in DAILY TIME FRAME...
INDUSIND BK - 4 HR Time frame As the formation of double bottom and RSI divergence we can go LONG as like RR in the chart
In USDCAD 1 HR chart Feel its the right time to catch those who miss the double bottom .... RR is shown in the chart
In the Daily Time frame There's a bearish cypher formation in ULTRACEMCO So we can enter SHORT like in the RISK REWARD ....
In the 1 Hr time frame USOIL about to form REVERSE HEAD & SHOULDER... If this happen mean we can enter LONG for the target of $ 72...and on Let see...
Market Analysis Gold price action forms ABCD pattern which push the price movement down to the 0.618 retracement , so from the recent high 0.618 retracement will be 1213.60.. So it will be the NEXT SUPPORT level for GOLD..
Market Analysis In the DAILY timeframe a BEARISH CYPHER is formed ..so we can enter SHORT for 0.382 / 0.618 retracement
In the DAILY timeframe HINDALCO forms the BULLISH GARTLEY pattern...so we can enter the LONG as per the RR shown in the chart..
Market Analysis In US OIL $70.85 looks a great RESISTANCE zone and after yesterdays raise now oil trades in that zone more over it also forms a BEARISH CYPHER pattern in DAILY time frame... So i could expect a 0.382 retarcement upto $68.14 level May be a sharp fluctuation @ today's inventory time... Let's see....what's going to happen..
In the 1 HR Time frame NIFTY forms the BEARISH GARTLEY pattern so we can enter SHORT for 0.386 & 0.618 retracement like the chart
Daily time frame shows prices were at strong resistance zone and while looking back it shows a 3 DRIVE PATTERN... So i expect short correction upto $64... so traders watch this zone care fully in this current situation ....
We can Enter SHORT TRADE in US OIL for 0.382 retracement due to the below reason BEARISH GARTLEY Completion in DAILY TIME FRAME
We can Enter SHORT in WIPRO (CMP 285) for the target of 255 & 240 Because in DAILY timeframe this stock completes the HEAD & SHOULDER pattern with SL 310
Hello Traders, Pls watch the Price level between 59.37 - 58.80 to ENTER LONG for 0.382 & 0.618 retracement with SL $ 57.28because .... In that level i presume 2 HARMONIC PATTERS were completed...So i feel its the GOOD OPPORTUNITY with high probability.... GOOD LUCK


