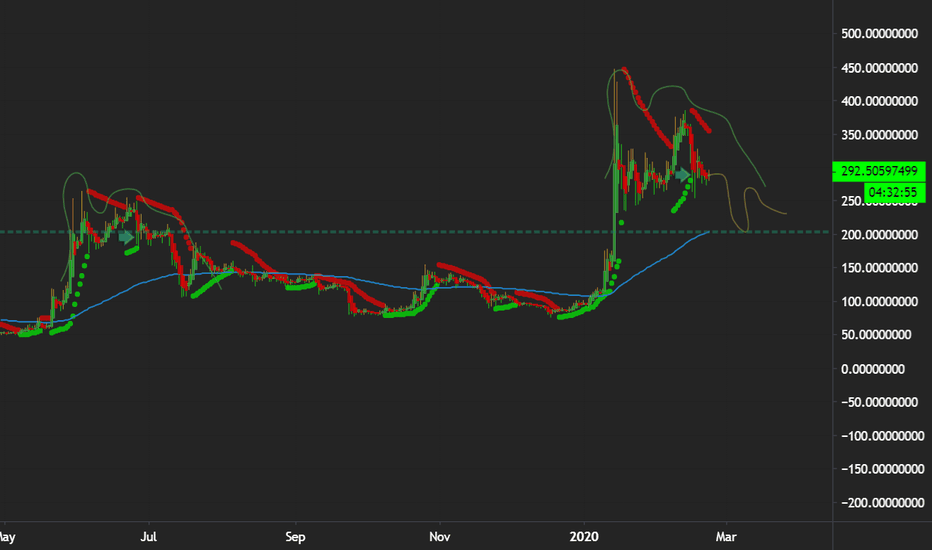
just hit $170 watching for new movement in incoming hours / days
top $200/220+ #bsv top #btc $8000+ low bsv $100/95 low btc $4500 support average $130 upper support $146
high 313/324/330 stop lose 274/277 low under 200 / 175ish next down 120/ 109 ish then back up to new ATH
seem likely to dump under $200 if we keep this trend
zooming out weekly chart shows incoming rise to first target with prices of bitcoin core at over 10600 that would make bsv over $400 while bch still struggling to keep up its 0.30 btc fall from 0.066 bitcoin cash lost more than 50% of its value while bitcoin, sv gaining value
a same pattern emerging from jan shows a possible jump to 400 then 1200 not sure yet still waiting for a fallen wedge
just few bsv movements high 1200 mid 550 low 63 side ways 240/350
Bitcoin, Core btc weekly chart $6000/$5000 projection for the next 300 days no good news no projects insight whales sold at the top time to feed them at the bottom
20k 18k 15k 7200 13k 20k 26k 29/30k
target to 10k/$10700 Near the 30th of june into july or before if it break's my trend lines upwards near the 15th 17th my guess would be more approaching the end of june into july
weekly chart's show's the sar indicator will most likely turn green long term price rages 4200k 4600 uptrend back to pre-dump prices around 6400 from the 30 week downtrend and 60 week dump since ATH $19903 a -83% drop since dec 2017
8380 low 8700 mid 9400 high 10400 tops if it dumps crash low 7000
looking very bullish we might see alts start to rise and follow the btc trend we might see btc to 6300 to 7500 we might be in a bull run to 20k just like in nov 2017


