thecharttechnician
My analysis including calculations are shown on the chart not requiring descriptive analysis. After all, TA meant to be visual analysis. Enjoy! This analysis is for educational purposes only and it is NOT an INVESTMENT ADVICE.
What is the ultimate goal in Charting ? Could it be a profitable trade/investment ? Does it matter if the intended trade/investment is trend or counter-trend ? Not in my book, as long as the multi time frame analysis is done thoroughly. Are there guarantees either way(trend or counter-trend) ? A big NOOO. If I was to open a position with CGF, would I use a...
As the SMART MONEY trapped the short seller 3 times since July, in order to accumulate for medium/long terms, their motives gave us couple of bullish targets to watch going forward.Since both Vertical and Horizontal counts are identical, I am only publishing the vertical count as shown on the chart for educational purposes only. Analysis continues....
23 of August I have published the Monthly chart. Today what I was anticipating has happened.That is long entry intra month WYCKOFF WAY! THIS ANALYSIS IS NOT AN INVESTMENT/TRADING ADVICE.
Still a secondary correction within a major uptrend in major time frame monthly with LOW RISK LONG ENTRY pending. End of Month close above Climax Low of $6.50 is what I am looking for.A perfect Turtle Soup entry that would be ! This TA analysis is not to be taken as a financial advise.
Completed pattern with target as shown on the chart is for educational purposes only.
Two active and valid upside target calculations are shown on the chart is for educational purposes only. Enjoy!
Completed pattern and a forecast target as shown on the chart is for educational purposes only.
This analysis is for educational purposes only. Lets see if we can uncover the motives of the smart money through our charts ? Still within a major downtrend with potential upside breakout pending to complete an accumulation base may best describe the trending conditions that Telstra is in at present. Lets now look at the past price action behaviour within the...
Within a major downtrend and a potential Head $ Shoulders Bottom Pattern with it's target as shown (if the pattern is successful). Can it crack the NECKLINE resistance and race to it's target ? Wait and see from here on... This analysis is for educational purposes only and it is not an investment advise.
Candle of interest (Penultimate candle) is marked on the chart. End of week close above or below this candle would suggest a re-test of two levels as shown(13800 on the upside or 3850 on the downside). Which way ? Wait till bulls or bears make their move and show their strength as well as commitment. This analysis is for educational purposes only.
I start with the following question to all chart lovers. Do you know anyone who traded someone else's so called magic method and made money ? Be careful and learn to do your own analysis as well as calculate your REWARD/RISK and the appropriate position size. Here is the weekly bitcoin chart with lots of short term swings and roundabouts. Can you see a trend ?...
Simple answer would be, if it cracks the significant resistance level in the zone of 10000-10500 it is likely to race higher even if it doesn't make it to the moon.A significant zone of resistance to overcome this zone is. Up trending channel is still in effect and it's support/demand line is now being tested.If the demand line is violated ( so far so good) then...
This analysis is for educational purposes only. Volume is leading the price with a bullish posture. Can the price follow suit ? Exhaustion/Climax periods ( weekly bar in this case) are more likely than not signal the beginning of the end. Two of those are marked on the chart INCLUDING THE CURRENT ONE. At a make or break level Bitcoin as it is now testing the...
All one need to know, in terms of where the precious metal might be headed is shown on the chart. Please be also note that, this analysis is for educational purposes only.
This analysis is for educational purposes only and it is NOT an investment advice. Textbook perfect pattern which is yet to be completed as shown with the precious metal. An Inverse head and Shoulders continuation pattern as shown. If successful, will we see the precious metal around 2K zone ?
The mighty DOWN THEORY application in determining the trend condition/status of this instrument BTCUSD is for EDUCATIONAL PURPOSES ONLY. It ( DOW THEORY) is not intended for timing must also be said.It alerts us to a change in trend. I have marked the important changes on the chart where trend change in INTERMEDIATE TERM had taken effect.Advances are marked in...
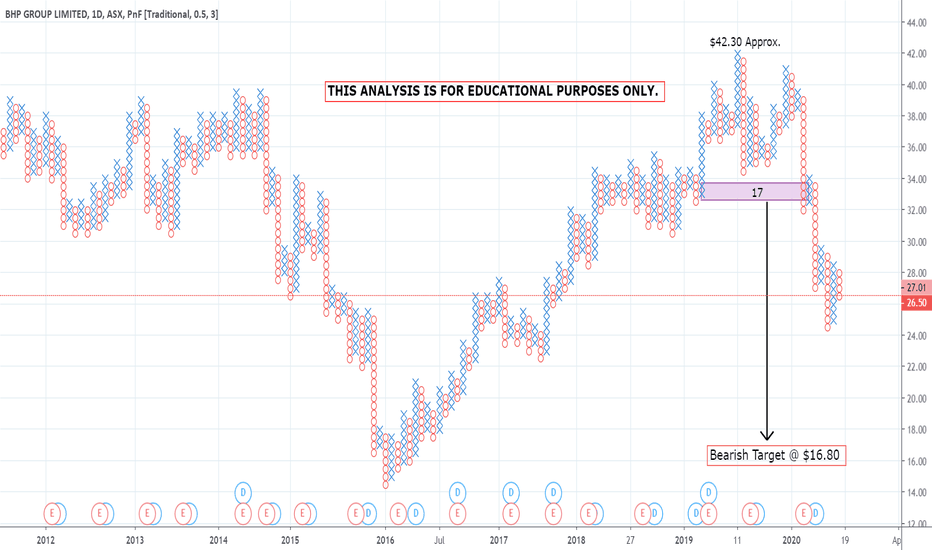
THIS ANALYSIS IS FOR EDUCATIONAL PURPOSES ONLY. BEARISH TARGET AS SHOWN ON THE CHART AFTER THE COMPLETED TOP.


