theeonlydave
Xrp has a structure of a head and shoulders(H&S), with the second leg developing after breakout and retest. Meaning it will drop all the way to 0.5098
The is a triple bottom or a diamond pattern that indicate there will be a bullish movement upwards especially after the retest at 146.502. The move will be until 150.000
Gold has a clear IH&S(Inverse Head & Shoulders. It shows gold will move upwards all the way to 3200.
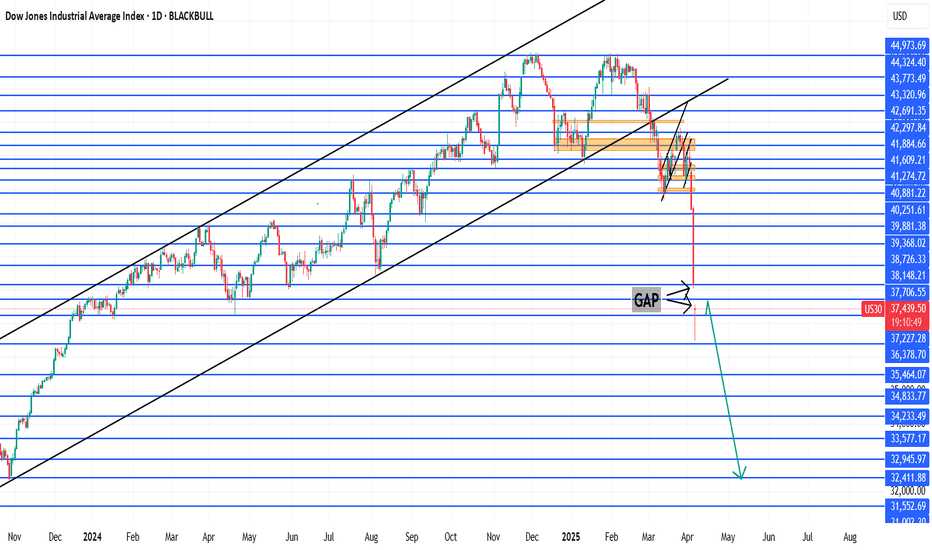
There is currently a huge dragon fly doji that might change to a hammer candle, cause a small bullish movement to 37706.55 where there is a gap before continuing downwards to 32411.88
There is a huge dragon fly doji currently,but if price moves to 16927.4 and fails to break through that price zone,it will continue downwards until 14121.6
Cookie is going to continue dropping until 0.0186. WHY? - If you are observant, you will see a H&S(Head and Shoulders) pattern as the overall structure.But within it, there is an (M) formation and a (W). - The other leg of the H&S is the one being formed and that translates to a movement down wards the the price level of "0.0186."
Once price reaches 3004.6 and retest that level then it will complete the final part of the (W) formation.
There is a visible head ans shoulders pattern, CPI can either invalidate it or validate it. 10 more minutes
The Gold chart has a lot of info in display.If you go with the most current structure, you will see an (M) formation first,then a Bullish Flag and when you zoom out you notice a bigger structure of an Inverse Head and Shoulders(IHnS). So basically, there should be a short term sell to complete 90% of the M before moving upwards. This would mean placing a reminder...
I see a long position from 0.00043262 all the way to 0.00073280 based on the clear triple bottom denoted in the chart with 3 arrows.
If price hits hits the upper part of the H4 resistance zone which is at 20300.7, and fails to break out above that level, then i foresee a massive sell downward to 18456.8
Trump/Usd as formed a W or double bottom structure which will move from 13.27 all the way to the TP at 16.92
US30 has a (W) FORMATION that is in play currently. playing around 43758 that is a retest before the move upwards all the way to 44714.83 to complete the (W) formation. N/B: Its NFP week, SO BE CAREFUL
EURUSD seems to be printing an Inverse Head and Shoulders(IHnS) which will be valid if price passes 1.04160 retest and continues with the take profit being 1.08826. Alternatively, a sell could take place especially because its NFP week and price moves in a bipolar manner.For this to be valid, price would need to fall all the way to 1.03500 retest and then the...
I see a short time sell before a big bullish move upward.
There are two structures in clear display for everyone to see: - Primary Structure - Secondary Structure This is basically as many would say a trend in trends that offer bullish signals. Primary Structure: is for a swing trader while,the Secondary is for a day trader that want to get his quick and small slice of the pie as others that the longer approach. I see...
Trump Coin displays a bullish pattern which if timed well at $12.85, one can either enter your trade at that point or wait to see whether it will move downwards to touch the bottom of the support at $10.48 and then enter. TP obviously at $75.95 but, its all depends on the trader.
There is a possible H&S forming and if it does complete its structure the price of Solana would be low.


