thesecards
i wrote in last post that we have a pennant but actually looks more like a rising wedge
premature but can see a falling wedge starting to form here
btc melting down broke a key fractal level and stochastics showing a lower level to go, rsi still not oversold
looks like another wave down coming, staying neutral here don't open longs until we get clear signs of reversal
ont shows possible breakout from bullflag but with bearish divergence, could pull back here before testing resistance again
btc coming close to a TK cross on the Daily, the last 2 times it did a bull cross are shown in the chart and signaled a strong rally by bulls
using log scale and drawing from body not wick
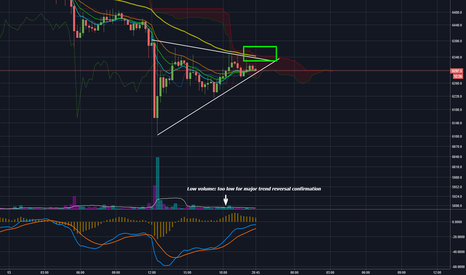
i remain neutral on btc leaning more bearish this idea shows two white lines showing support and resistance levels waiting to see which way it goes must close below/above the white lines
price action has formed an upper support line in white, a break above plus short term EMA's crossing the yellow EMA could provide a breakout, however i feel like it will most likely fail volume is too weak.
ven falling hard, disappointed had high hopes for the month of june, MACD daily looks about to cross signaling death support shown in the 2 white lines if it continues to fall, pretty hard to find anything bullish in the market right now without being bias
showing some divergence in rsi , MACD hopefully produces buy signal shortly for confirmation targets 1 and 2 are shown
btc random thought of mine with fibonacci, previous low bounced off .618 extension


