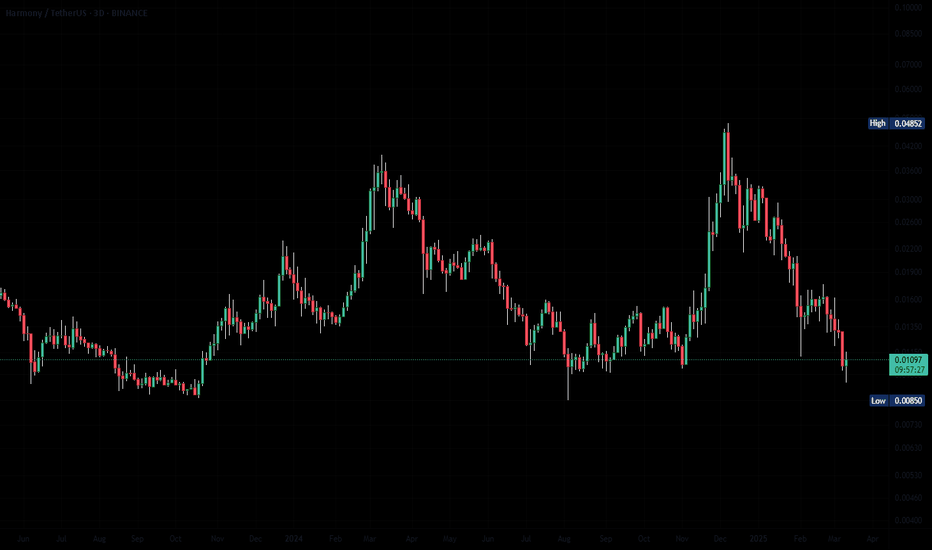
if this holds (i.e., 3D closes green, volume stays green and above average), this looks pretty bullish.
I don't care much for SHIB, but can't ignore that if this holds (i.e., 3D closes green, volume stays green and above average), this looks pretty bullish.
if this holds (i.e., week closes green, volume stays green and above average), this looks pretty bullish.
if this holds (i.e., week closes green, volume stays green and above average), this looks pretty bullish.
Rocky Mountains is not a real thing, but it was the first term to come to mind when looking at this pattern. If this plays out, it would take weeks to months before anything comes of it. Simply charting this to reflect back on in the future to see what this pattern reveals. I'm simply playing hidden bullish divergence here, especially considering the fed with...
Earnings coming in 2 days which is clearly a binary event, but based on technicals, I see a the potentiality to short here. I'm looking at a swing with puts 1 or 2 legs OTM. More than likely, it will be an ATM put debit spread with a leg ITM and a leg OTM.. if you have less funds and a higher conviction, an OTM debit spread 2 legs or so OTM may be a try. If...
1. Playing the bearish divergence here. 2. Not seen here, but a rise in selling pressure (volume) was seen at the end of the trading day on Friday (4/28). 3. RVOL is slightly up, which is this case shows the bearish volume is higher than typical AKA above average. 4. Oscillator divergence starting to break down as price simultaneously makes newer highs.
Potential short? Weekly candles, so give it time to play out. Still have another 2 days left in this current weekly candle, so this is essentially a front run move, but that's why we have stop losses. If macro markets drop this will obviously follow. Key fib level at 0.886.
An above average green volume bar here and a daily close above the trend line could spark a new up swing. If we break out, expecting a potential retest at the same green line—where resistance turns support, then continues up. Let's see.


