tmp_cox
look at the chart for further information
look at the chart for further information. Retracements are based on Fibonacci retracements.
look at the chart for further explanation
IAEX CFD-version. Look at the tracements. tracements are based on Fibonacci because markets has given some corrections wich also relate to volatile markets (difficult to use quantitve technical analysis)
Nikkei already dropped Oldtimehighs Buy-and-hold till the closelevel is reached (correlation between AEX and NIKKEI)
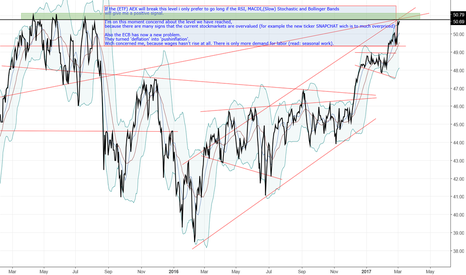
CHARTDESCRIPTION If the (ETF) AEX will break this level i only prefer to go long if the RSI, MACDI,(Slow) Stochastic and Bollinger Bands will give me a positive signal. I'm on this moment concernd about the level we have reached, because there are many signs that the current stockmarkets are overvalued (for example the new ticker SNAPCHAT wich is to much...
Only based on technical analyse
Broken flagpatern: Longsignal Relaxed RSI, Stochastic and MACD: Longsignal Positive Moving Averages Upcoming: 3 march: Consumer price index japan -> expected increase of the consumer price index influence of the consumer price index on GDP: if the consumer price index has growth, Japan has to have an bigger GDP as forecasted... 8 march: GDP (Q4) of japan
If we look at the indexchart of the AEX (dutch25) we are seeing high consolidation. This means that markets are on this moment unpredictable and are waiting for more information. Why can't we predict the markets? Because we saw at the past that markets dind't react as expected on politics and economic data. This means that the most people are afraid to place...
This chart is based on the Gann-box. I saw this patern on a day-graph of the FTSE100. When the chart reach >0.75 we seek a parbolic arc that pedicated a drop. On this moment the same is happening. After this correction the markt will follow an upwards trend.
Technical Analyse: - Look at the figure - RSI, MACD and Stoch. are positif
Based on RSI, MACD and Slow Stoch. Option 1 = the perfect predicted trade Option 2 = the risky trade Technical Analyse: Strong upwards trend that hits the overbought level. Information deserved from: ING_financialmarkets, RTLz and Bloomberg
Look at the chart for further information. Why should you buy? In the 15-minute chart of 4-1-2017 i dind't see reasons why you should not buy as a swingtrader: 1drv.ms Why should you wait for more information in the market? Because the markets dind't react as we expected the last times (Brexit, Donald Trump, Fed, ECB etc.) So in this case: *Wait for the...
I based my opinion for 2017-2018 on macroeconomic statistics/ indicators deserved from the FED In this chart you can find the following indicators: - Average (mean) duration of unemployment - Velocity of M2 stock (included trendline) - S&P500 (included trendline) I have searched for opposite movements in the statistics/ indicators
In the follow graph you can see the following 'stocks': GOLD ETF, AEX (indextracker) and Unilever You can also see the expanded ghost patern that will predict the marketmovement/divergence between the 'stocks'. In this case: GOLD will fall = AEX will rise | Unilever will fall or rise 3.5% more than the AEX will rise or fall (or) AEX will fall = GOLD will rise |...
The following chart is a daychart: Strategy in buy/long-context: 'If you buy 1x Nikkei225 , buy 2x more stocks of financials (ABN AMRO) and short GOLD' In a more economic theoritical way: 'If gold rise, the indices will fall and financials will fluctuate heavy' Information deserved from: ING, Bloomberg and HSBC
In the following content i will explain how you can forecast the market with CPI (inflation) and Financials: If we look at our figure we can say a few things, i will assume them below: 1. ABN AMRO (a dutch Financial) is highly correlated to the NIKKEI225 index. 2. Since nearly May 2016 we can see that the CPI (inflation)-chart has change 5 times. If we look at...
REPORT look at this figure carefully and let me know what you think. (it is based on indices, oil and economic-forecasting) information deserved from: bloomberg, new.tradingview and the economists.


