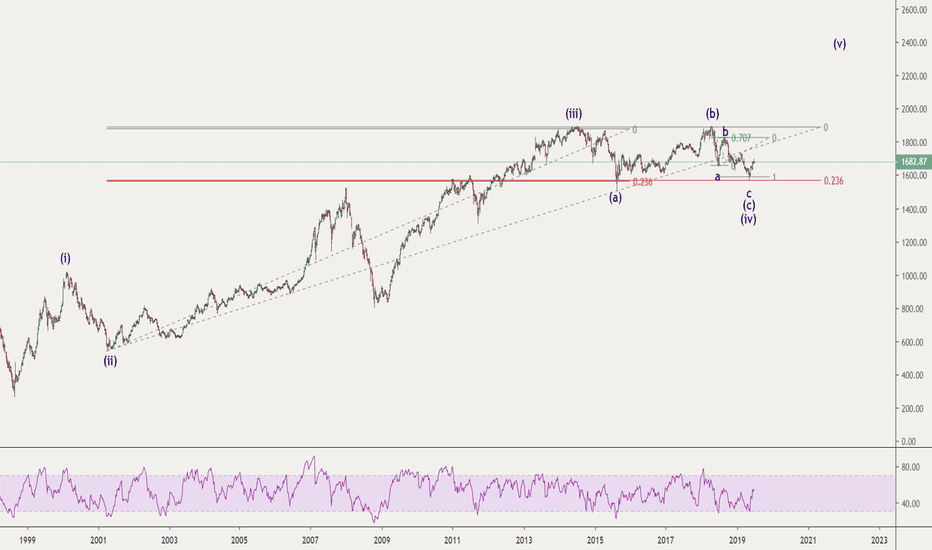
Never ceases to amaze me how these charts exhibit almost perfect EW characteristics at times, in this case with the fib retracements. One thing going against this count is that the EW theory of alternation says that where wave 2 was shallow then wave 4 is expected to be deeper. Not always the case though and I suspect we could well see some further upside in...
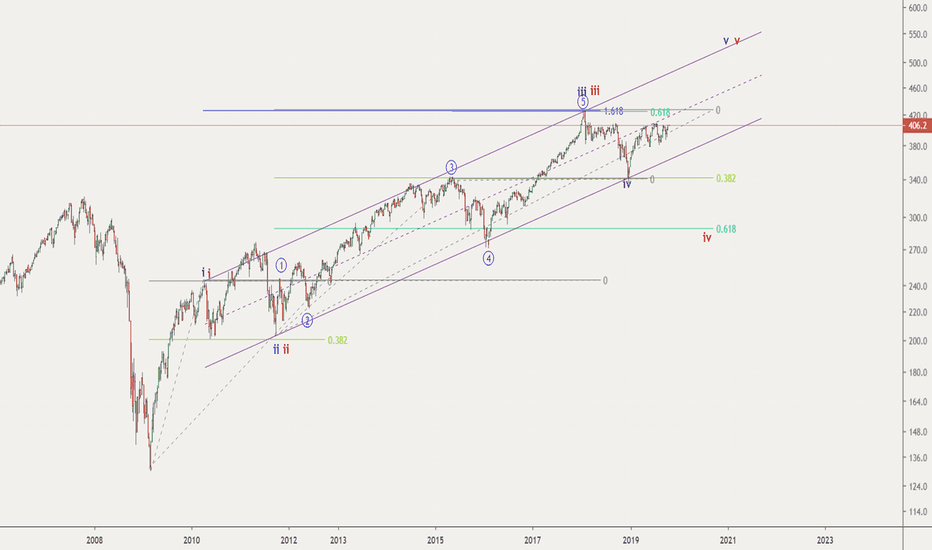
Same EFT, a UK listed etf for the SP500 priced in GBP. The chart on the left is in log scale and the one on the right is arithmetic. One bullish while the other channel suggesting a top is already in place. Annoying really. However, looking at other charts in various markets it would suggest to me that it may still have further to run.
Here's a UK listed Robotics etf where I couldn't help noticing the almost perfect the fib measurements and how clear the count is.....bullish indeed or a recipe for disaster? I'm in the bullish camp.
According to this count Silver (priced in GBP) is due a correction but it would also suggest that we can expect a 5th wave up to complete the move. The only question I ask myself in this case is if this is way too obvious and easy and therefore to expect something completely different to unfold.
I posted a really bearish chart on commodities back in 2018 but this chart, while still eventually bearish in outlook, suggests that we might see some strength in commodities at least in the medium term. I have included a very bullish blue count that goes one step further in suggesting that commodities may have in fact bottomed.
Not much to go on here except that the Bursa has bounced strongly on the 23.6 fib retracement after what might be a ziz-zag correction.
Here's a count to cheer up the bulls, eventually. While it suggests that a 5th wave may have been just completed it also suggests that after a decent correction we may see some really bullish price movements in this stock. Interesting to me how all the fib measurements are almost perfect within EW theory. Lets see how it pans out.
For me, a fundamental problem with Elliott Wave is that in my case my mood can shape my count. Gloomy mood equals bearish count, cheerful mood equals bullish count. This count suggests a top in Dutch equities with a decent correction to follow. I am expecting to be wrong........but you never know.
Suggesting some bullish possibilities here for TLT.
Some nice things going on here with fib measurements fitting nicely and a parallel channel that is holding well. Personally, I like the blue count but I have included the red count to suggest a deeper correction could still happen.
I'm still bullish equities but reckon that a few markets might be due a decent correction. This count makes that case for this index that one is due to start sooner rather than later.
Here I go again....calling tops in a market that has been relentless in it's uptrend for the last few years but could these be possible counts for the Nasdaq to at least show a decent correction?
A couple of bullish counts here for ROKU, with the blue count being the preferred one. If I'm right, and that is a big IF, it would also suggest we may be about to see a bit of risk-on in the equity markets after a lot of chopping around......
This rather optimistic count for the Hang Seng would be invalidated with any break below the 24537 level.
It's been a fabulous ride for holders of stocks in this company. However, I read an article concerning how the founders of this company have been selling a lot of their stock in since the beginning of the year and produced this as a possible wave count (calling tops usually leads to egg on faces).
I don't own any bitcoin and don't trade it but still like to follow it, as it's fun and interesting. It also seems, in my opinion, to carve out patterns that follow many tenets of Elliott Wave. Right now. is it in the process of completing a complex 4th wave correction? Has it finished or nearly finished a 5 wave C wave down to complete the double zigzag...
I still reckon there is some decent upside in equities going forward but also think we may need a bit of a shakeout first.
I still favour the red count here which would suggest more weakness going forward for the British Pound.


