This analysis suggests that the DAX (along with many other major indices) may see a decent correction in the coming months but I am still expecting a decent leg up to come which I will be waiting for. It never ceases to amaze me how many times the same fib ratios come into play as in this case.
Always risky calling tops especially after the run this stock has had but I'm calling one anyway. Reckon 5 waves might be in....
A number of factors shown on the chart suggest that this US stock may be in for some sustained downside.
The parallel channel and the fact that wave 5 may be the same length as wave 1 might suggest a short term top is in for this index.
In my mind this stock may have. or be about to, finish a long run up that began back in 1996. From a purely visual perspective on the arithmetic chart it looks like that the run up from 2009 may be an extended wave 5. If that is the case expect a severe drop when it does turn. For my 5th wave I have included 2 possible counts, one which finishes the wave 5 already...
Further to my last chart on EasyJet the share price ran up nicely in what is perhaps 5 waves. Now it has bounced at exactly the 50% retracement of the move. I will be looking for a sustained move up to see if my forecast of a potential 3rd wave, is correct.
Might be approaching a wave v top but this count suggests that the long term trend is definitely upwards.
2 possible counts I'm following for this UK resource stock. If this is minor wave 1 of a renewed uptrend then it may well be due a decent correction before continuing upwards.
As ever with Elliott Wave, it just suggests a few possibilities and the correction may in fact have further to go. This count however suggests that there is more upside for the FTSE 100 from here although how much higher it will go in this sequence is not an exact science. I have put a few possibilities on the chart but also of note is that there are a number of...
I think I've got another count where I have this pair showing expected EURO but some of the Fibonacci numbers here caught my eye so I will be watching to see if perhaps Sterling strength is here to stay, at least in the short term.
Assuming that my wave (2) is in fact wave (2) and not just (A) then I reckon there could be some serious upside for this emerging market (and others) going forward once wave 2 is out of the way. This wave (1) comes after a long term decline and would suggest that a wave (3) could be coming sooner rather than later.
I have highlighted a few areas where parallel channels and key Fibonacci numbers might suggest some upside targets for this index when coupled with my EW count. My only concern here is that perhaps it all looks too obvious and the market may have other ideas.....
Pretty simple analysis but looks bullish to me for the FTSE 100 for the coming months.
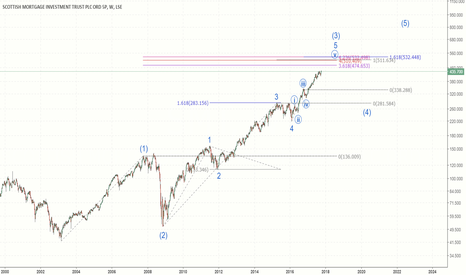
A while back I unsuccessfully called a top in this global equity investment trust and it replied by steaming higher. I'm having another go here at calling a top of a wave 3 that, according to this analysis, began back in 2008. However, I think there may well be more upside before any major correction as highlighted on the chart.
If my count is the correct one then I am expecting a decent rally in this UK stock possibly above 300.
Not much to look at here but this ETF has bounced against it's 78.6 extension of my wave A and a median line on a Schiff pitchfork. Good place for a decent rally perhaps?
Calling a top in this US stock is borderline madness but these Fibonacci measurements in this Wave count, coupled with the present head and shoulders pattern, might suggest it right now.
This is a more bullish count for this currency pair that suggests that once the 4th wave correction is over there may well be further upside. A more bearish count would be for the 5 waves to be already completed with the touch of the median line of my pitchfork and the present correction to be bigger than shown.


